Unlock a world of possibilities! Login now and discover the exclusive benefits awaiting you.
- Qlik Community
- :
- All Forums
- :
- QlikView App Dev
- :
- Re: Displaying last 5 days data in the bar chart
- Subscribe to RSS Feed
- Mark Topic as New
- Mark Topic as Read
- Float this Topic for Current User
- Bookmark
- Subscribe
- Mute
- Printer Friendly Page
- Mark as New
- Bookmark
- Subscribe
- Mute
- Subscribe to RSS Feed
- Permalink
- Report Inappropriate Content
Displaying last 5 days data in the bar chart
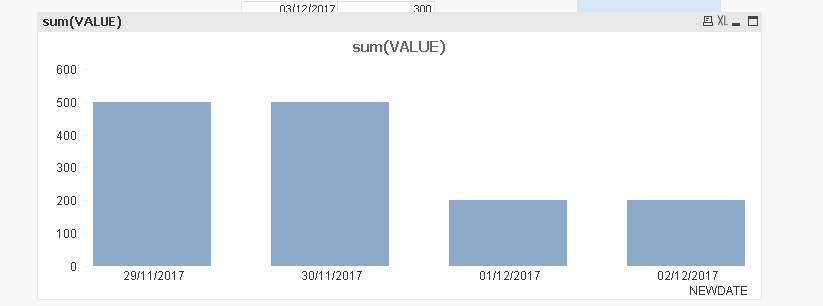
As attached I have data set
my basic requirement is tooo get last 5 days data for example
wanted to view data for 29/11/2017 500
30/11/2017 500
01/12/2017 200
02/12/2017 200
03/12/2017 300
Total 1700/-
In bar chart last 5 days
- Mark as New
- Bookmark
- Subscribe
- Mute
- Subscribe to RSS Feed
- Permalink
- Report Inappropriate Content
In image, There is 4 and 5th dates also should be placed right? May be Rank - chart function ‒ QlikView
- Mark as New
- Bookmark
- Subscribe
- Mute
- Subscribe to RSS Feed
- Permalink
- Report Inappropriate Content
on 29th the value is 500 and on 30th also 500 total for november month will be 1000
from 01/12/2017 it is 200 and 02/12/2017 so it should aggregate 400 in date 02/12/2017
- Mark as New
- Bookmark
- Subscribe
- Mute
- Subscribe to RSS Feed
- Permalink
- Report Inappropriate Content
When you use Date field as dimension and you want to be Month aggregated, should be this?
Sum(TOTAL <Month> VALUE)
Sum(Aggr(Sum(VALUE), Month))
- Mark as New
- Bookmark
- Subscribe
- Mute
- Subscribe to RSS Feed
- Permalink
- Report Inappropriate Content
Hi,
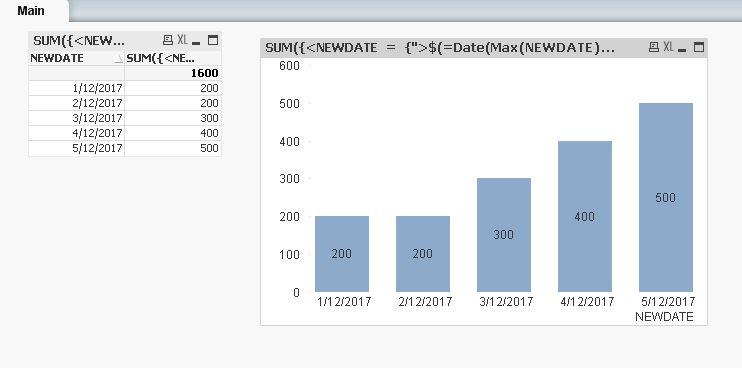
Try to use date range in set analysis expression
SUM({<NEWDATE = {">$(=Date(Max(NEWDATE)-5))<=$(=Date(Max(NEWDATE)))"}>}VALUE)
Fact:
LOAD Date(Date) as NEWDATE,VALUE INLINE [
    Date, VALUE
    29/11/2017, 500
    30/11/2017, 500
    1/12/2017, 200
    2/12/2017, 200
    3/12/2017, 300
    4/12/2017, 400
    5/12/2017, 500
];
- Mark as New
- Bookmark
- Subscribe
- Mute
- Subscribe to RSS Feed
- Permalink
- Report Inappropriate Content
THE ABOVE CONDITION IS WORKING FINE ONE MORE REQUIREMENT
I WANT TO AGGREGATE THE TOTAL WITHOUT SELECTION
- Mark as New
- Bookmark
- Subscribe
- Mute
- Subscribe to RSS Feed
- Permalink
- Report Inappropriate Content
Does it mean these?
Sum({1} TOTAL <Month> VALUE)
Sum({1} Aggr(Sum({1} VALUE), Month))
- Mark as New
- Bookmark
- Subscribe
- Mute
- Subscribe to RSS Feed
- Permalink
- Report Inappropriate Content
THE SAME CONCEPT CAN BE DONE AT BACK END devarasu07
- Mark as New
- Bookmark
- Subscribe
- Mute
- Subscribe to RSS Feed
- Permalink
- Report Inappropriate Content
Hi,
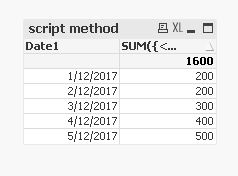
Yes, try like below,
Temp:
LOAD * INLINE [
    NEWDATE, VALUE
    29/11/2017, 500
    30/11/2017, 500
    1/12/2017, 200
    2/12/2017, 200
    3/12/2017, 300
    4/12/2017, 400
    5/12/2017, 500
];
vMax:
load max(Date(NEWDATE)) as MaxDate Resident Temp;
LET vMax = floor(Peek('MaxDate'));
LET v5DaysAgo = floor(Peek('MaxDate'))-5;
Fact:
load Date(floor(NEWDATE)) as Date1, VALUE Resident Temp where date(NEWDATE)>date('$(v5DaysAgo)') and date(NEWDATE)<=date('$(vMax)');
Drop tables vMax, Temp;
- Mark as New
- Bookmark
- Subscribe
- Mute
- Subscribe to RSS Feed
- Permalink
- Report Inappropriate Content
I WANTED TO INCLUDE 29TH 30TH 1 2 3 AND DISPLAY