Unlock a world of possibilities! Login now and discover the exclusive benefits awaiting you.
- Qlik Community
- :
- All Forums
- :
- QlikView App Dev
- :
- Document/Report to fit A3 Size Print
- Subscribe to RSS Feed
- Mark Topic as New
- Mark Topic as Read
- Float this Topic for Current User
- Bookmark
- Subscribe
- Mute
- Printer Friendly Page
- Mark as New
- Bookmark
- Subscribe
- Mute
- Subscribe to RSS Feed
- Permalink
- Report Inappropriate Content
Document/Report to fit A3 Size Print
Hi Experts,
I am working on creating a document/report that fits A3 Page Size on Print.
Once I put around 6 charts on the report, the print layout is minimising the charts and not all the X-axis values are visible.
This is the first time I have build such a report. Any idea how to make it work better?
Thank in advance for any help here.
Regards,
shyam.
- Mark as New
- Bookmark
- Subscribe
- Mute
- Subscribe to RSS Feed
- Permalink
- Report Inappropriate Content
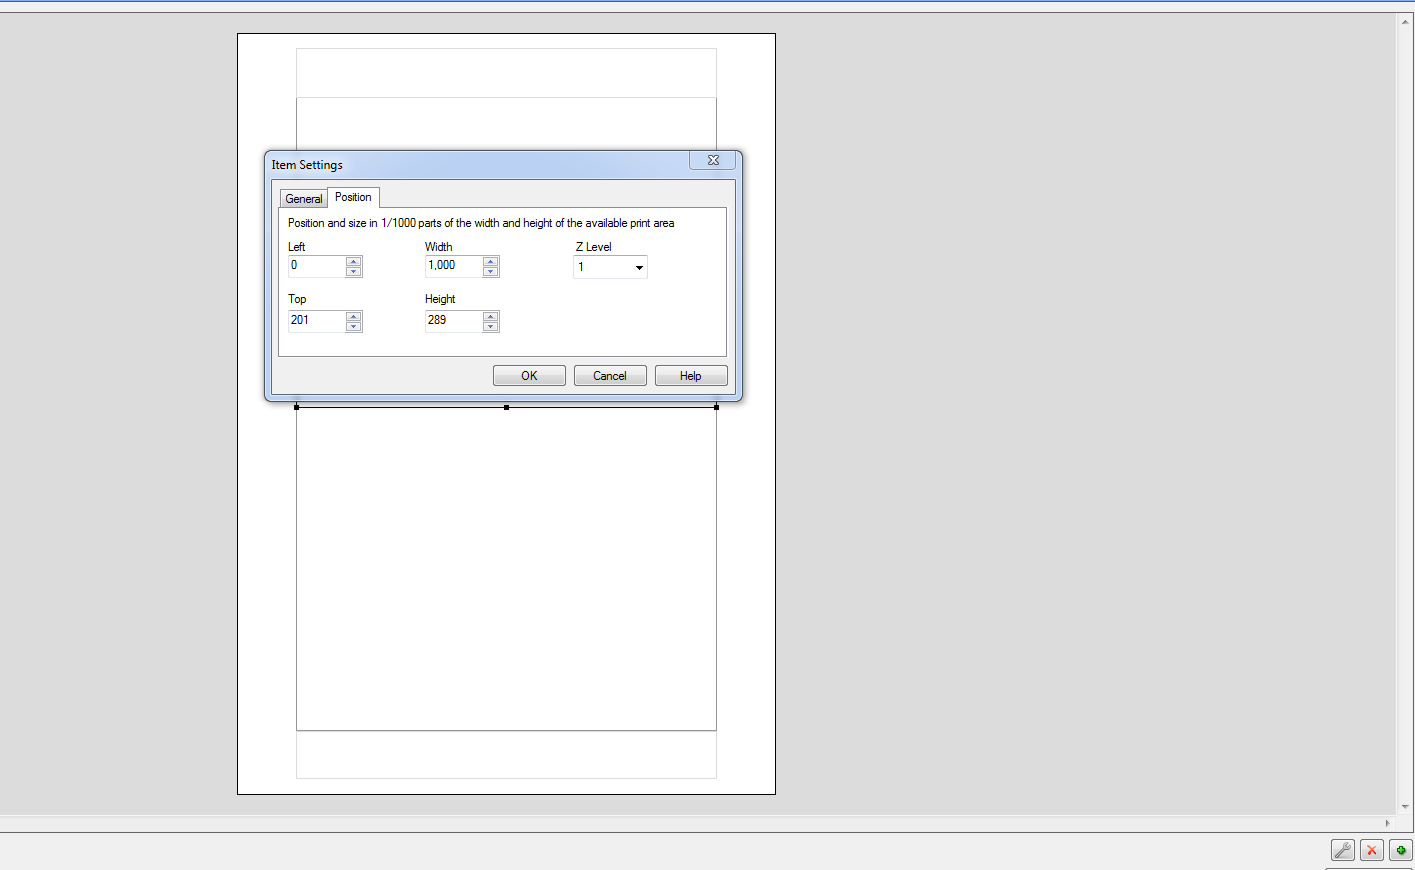
 Click on Setting Button and define length and width as per A3 size
Hope this may solve your issue.
Vikas
If the issue is solved please mark the answer with Accept as Solution & like it.
If you want to go quickly, go alone. If you want to go far, go together.
- Mark as New
- Bookmark
- Subscribe
- Mute
- Subscribe to RSS Feed
- Permalink
- Report Inappropriate Content
Hi Vikas,
Thanks for the response.
My requirement is to fit 6 charts on A3 width paper and to display the X-axis values as normal.
No matter what i do all the charts are squeezed and the x-axis of the charts are reduced to only a few values.
Thanks in advance.
Shyam