Unlock a world of possibilities! Login now and discover the exclusive benefits awaiting you.
- Qlik Community
- :
- All Forums
- :
- QlikView App Dev
- :
- Don't show the Expression which has NO Value
- Subscribe to RSS Feed
- Mark Topic as New
- Mark Topic as Read
- Float this Topic for Current User
- Bookmark
- Subscribe
- Mute
- Printer Friendly Page
- Mark as New
- Bookmark
- Subscribe
- Mute
- Subscribe to RSS Feed
- Permalink
- Report Inappropriate Content
Don't show the Expression which has NO Value
Hi All,
I need some help here. I am showing a chart data like this below:
| ID | 1 Month Sales | 6 Month Sales |
| 100 | 1150 | 7740 |
| 200 | 1420 | 6820 |
| 300 | 1890 | 6990 |
| 400 | - | 6510 |
| 500 | 1100 | 7180 |
| 600 | - | 6130 |
For MAR-2015 (when selected from a List Box), the ID 400 and 600 has no 1 Month Sales - So I don't need to show these 2 IDs in the chart. My expected chart will be like this below:
| ID | 1 Month Sales | 6 Month Sales |
| 100 | 1150 | 7740 |
| 200 | 1420 | 6820 |
| 300 | 1890 | 6990 |
| 500 | 1100 | 7180 |
Similarly when FEB-15 will be selected, some other IDs may not have 1 Months Sales data and I don't want to display them.
My 1 Month Sales and 6 Month Sales is calculated in expressions like this below respectively:
=Num(SUM({<[Month/Year]={'>=$(=Max(Monthstart(AddMonths([Month/Year],0))) ) <=$(=Max(Addmonths(MonthEnd([Month/Year]),0)))'}>}(([Sales]
=Num(SUM({<[Month/Year]={'>=$(=Max(Monthstart(AddMonths([Month/Year],-5))) ) <=$(=Max(Addmonths(MonthEnd([Month/Year]),0)))'}>}(([Sales])) ),'#0.00') )) ),'#0.00')
Please someone help here.
Regards!
- Tags:
- new_to_qlikview
Accepted Solutions
- Mark as New
- Bookmark
- Subscribe
- Mute
- Subscribe to RSS Feed
- Permalink
- Report Inappropriate Content
There are at least two ways to deal with it:
1. Replace dimension ID with a calculated dimension, which will be ID but only if the selected month's sales >0
2. Modify the second expression making it conditional
if(1st expression >0, then 2nd expression, otherwise 0)
- Mark as New
- Bookmark
- Subscribe
- Mute
- Subscribe to RSS Feed
- Permalink
- Report Inappropriate Content
Try If(Column(1)<>0, Num(SUM({<[Month/Year]={'>=$(=Max(Monthstart(AddMonths([Month/Year],-5))) ) <=$(=Max(Addmonths(MonthEnd([Month/Year]),0)))'}>}(([Sales])) ),'#0.00') )) ),'#0.00'))
talk is cheap, supply exceeds demand
- Mark as New
- Bookmark
- Subscribe
- Mute
- Subscribe to RSS Feed
- Permalink
- Report Inappropriate Content
There are at least two ways to deal with it:
1. Replace dimension ID with a calculated dimension, which will be ID but only if the selected month's sales >0
2. Modify the second expression making it conditional
if(1st expression >0, then 2nd expression, otherwise 0)
- Mark as New
- Bookmark
- Subscribe
- Mute
- Subscribe to RSS Feed
- Permalink
- Report Inappropriate Content
Hey Gysbert and Michael,
Thank you for all your help. It worked magically.
However 1 more help.
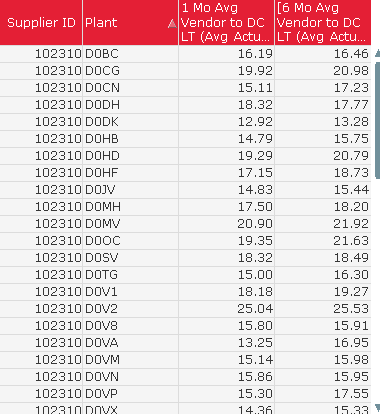
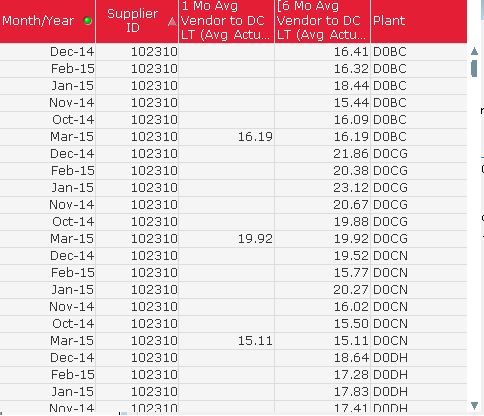
When I don't add the Month/Year field - The values are correct. But when we add the Month/Year field - that is splittd month wise (I don't want).
How to group by Plants in the 2nd image to show like 1st image?
Below are the two images - My data should be like the 1st image with a Month/Year field added. Please help


- Mark as New
- Bookmark
- Subscribe
- Mute
- Subscribe to RSS Feed
- Permalink
- Report Inappropriate Content
It's quite a different question...
Notice that it works only for March-15 - it is because this month is the max. Set analysis works with the overall data sets regarding chart dimension. You probably need to use if() function in your expressions rather than set analysis.
- Mark as New
- Bookmark
- Subscribe
- Mute
- Subscribe to RSS Feed
- Permalink
- Report Inappropriate Content
Can you please help here Michael. ![]()
My expressions are in my original post.
- Mark as New
- Bookmark
- Subscribe
- Mute
- Subscribe to RSS Feed
- Permalink
- Report Inappropriate Content
Your first expression most likely is simply
sum(Sales)
As for the second one, I don't have a ready answer. In this case if() is not going to help. Maybe some changes like adding flags are needed on the data model level. If you keep the second expression as is, it will return the result, but not the correct one.