Unlock a world of possibilities! Login now and discover the exclusive benefits awaiting you.
- Qlik Community
- :
- All Forums
- :
- QlikView App Dev
- :
- Drill Down Display
- Subscribe to RSS Feed
- Mark Topic as New
- Mark Topic as Read
- Float this Topic for Current User
- Bookmark
- Subscribe
- Mute
- Printer Friendly Page
- Mark as New
- Bookmark
- Subscribe
- Mute
- Subscribe to RSS Feed
- Permalink
- Report Inappropriate Content
Drill Down Display
Greetings,
I have a chart with a drill down group. The problem is when there are too many values in a field. Please look at the attached file showing groups and fields. It also shows the chart with the drill-down display problem in the lower right hand corner. What resolutions are availble to me to remedy this diplay issue?
Thanks,
Frank
- Mark as New
- Bookmark
- Subscribe
- Mute
- Subscribe to RSS Feed
- Permalink
- Report Inappropriate Content
Maybe you can enable X-Axis Scrollbar on the presentation tab, then set you number to be seen for each scroll.
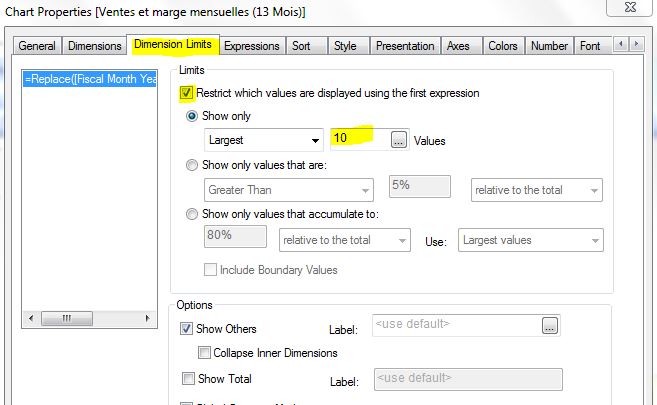
Or, set the dimension limits to show only first 10 largest values.
Hope this helps!
- Mark as New
- Bookmark
- Subscribe
- Mute
- Subscribe to RSS Feed
- Permalink
- Report Inappropriate Content
Good morning Frank,
Are you using QlikView 11.X? If so, you might want to consider configuring the Top X values you wish to display in order to focus on the most important data for your users. I invite you to look at the Dimension Limits tab under your graph's properties sheet:

Regards,
Philippe
- Mark as New
- Bookmark
- Subscribe
- Mute
- Subscribe to RSS Feed
- Permalink
- Report Inappropriate Content
Frank,
If it must be the bar chart, I'd go with the scrollbar as jerem1234 suggests. But my first preference is to replace the bar chart with the straight table. Maybe allow "fast type change" in addition to that.
Suggestion from Philippe works if you're OK with not showing smaller values.
Regards,
Michael