Unlock a world of possibilities! Login now and discover the exclusive benefits awaiting you.
- Qlik Community
- :
- All Forums
- :
- QlikView App Dev
- :
- Drill down in stacked bar chart
Options
- Subscribe to RSS Feed
- Mark Topic as New
- Mark Topic as Read
- Float this Topic for Current User
- Bookmark
- Subscribe
- Mute
- Printer Friendly Page
Turn on suggestions
Auto-suggest helps you quickly narrow down your search results by suggesting possible matches as you type.
Showing results for
Creator II
2017-07-18
01:59 PM
- Mark as New
- Bookmark
- Subscribe
- Mute
- Subscribe to RSS Feed
- Permalink
- Report Inappropriate Content
Drill down in stacked bar chart
Hi,
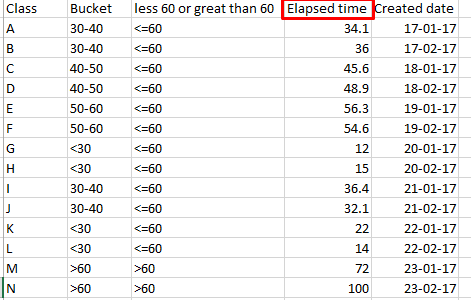
i have the data like as shown in the below image with buckets and less 60 or great than 60 is based on the field elapsed time.

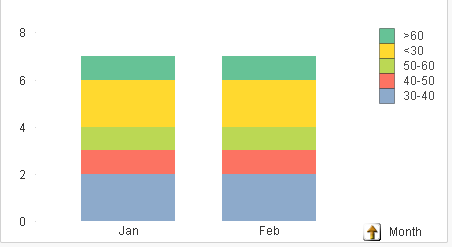
I have used the above data and got the stacked bar chart as below:

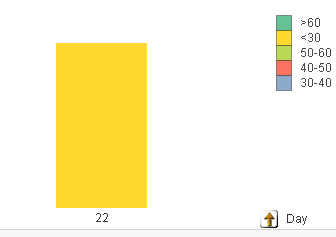
But if i select on the legends on <30 or some thing or click on any bar it must be drill down to as shown below

How to achieve it !!!
Any body can help me in this.
I have attached the data along with the application with expression used.
Regards,
Yoganantha Prakash G P
544 Views
1 Reply
Partner - Master III
2017-07-18
02:52 PM
- Mark as New
- Bookmark
- Subscribe
- Mute
- Subscribe to RSS Feed
- Permalink
- Report Inappropriate Content
hi
have a look at the attach example
447 Views