Unlock a world of possibilities! Login now and discover the exclusive benefits awaiting you.
- Qlik Community
- :
- All Forums
- :
- QlikView App Dev
- :
- Re: Expression results different in Straight and B...
- Subscribe to RSS Feed
- Mark Topic as New
- Mark Topic as Read
- Float this Topic for Current User
- Bookmark
- Subscribe
- Mute
- Printer Friendly Page
- Mark as New
- Bookmark
- Subscribe
- Mute
- Subscribe to RSS Feed
- Permalink
- Report Inappropriate Content
Expression results different in Straight and Bar chart
Hi Folks,
I'm using below expression in a straight table :
=if(Match(Name,'E'),NetWorkDays(min({$<Name=>}Date),max(Date))*8 ,NetWorkDays(min({<Name=>}Date),max({<Name=>}Date))*8)
Which is giving me desired output.
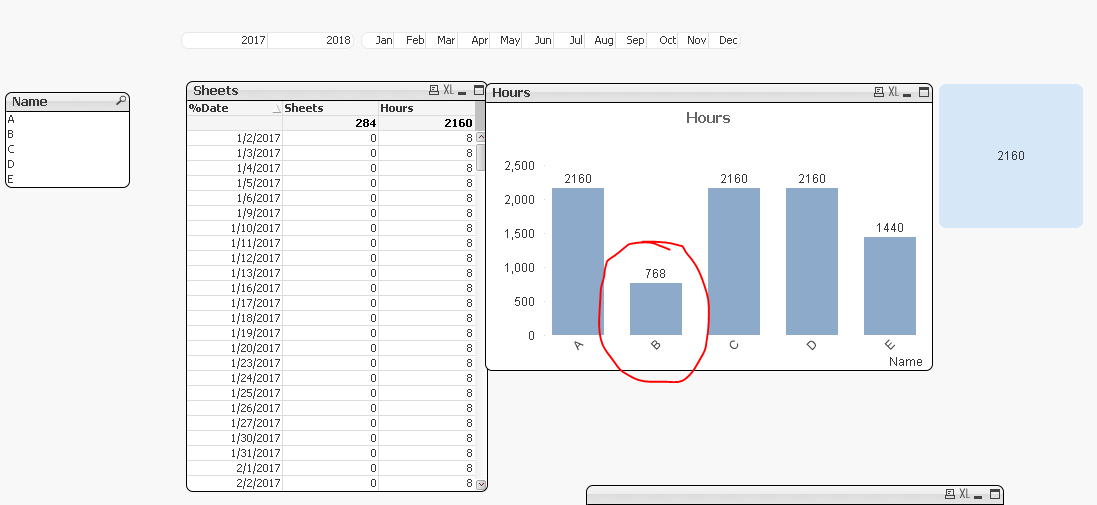
But when I'm using the same expression in bar chart results are different. For example :
When I'm selecting below Name ="A" , the correct number is 168 , but Bar chart is showing me 48

and same for E straight table showing me 48 , but bar 8.

Please suggest why , attached is sample data.
Note : For only Name ="E" Date is database is 9/8//2017 , so just for this calculation =NetWorkDays(min(Date),max(Date))*8) should run until 8th of Sep and for rest Names it should consider all Dates except weekends , doesn't matter if corresponding Date value available in DB and that's why I have created Master Calendar.
Regards,
Amit
- Tags:
- qlikview_scripting
- « Previous Replies
- Next Replies »
- Mark as New
- Bookmark
- Subscribe
- Mute
- Subscribe to RSS Feed
- Permalink
- Report Inappropriate Content
You logic make sense... but I am handling all that in the script... so will have to figure this out in the script first
- Mark as New
- Bookmark
- Subscribe
- Mute
- Subscribe to RSS Feed
- Permalink
- Report Inappropriate Content
I have added a new variable for Start Date for an employee... in the sample, I did it for Employee B check it out
- Mark as New
- Bookmark
- Subscribe
- Mute
- Subscribe to RSS Feed
- Permalink
- Report Inappropriate Content
Sorry Sunny , this is wrong.
Let me take example of E , as it is easy to explain.
When we are having below case of
LET vMinDate = num(makedate('2017'));
Output for E was '1440' across Year 2017 until 9/8/2017 (For this we have used EndDate Flag)
Now suppose if I'm changing LET vMinDate = num(makedate('2016'));
Than I'm adding one more extra year , which will for sure change values for all Name , further for E Min(%Date) is 6/1/2017 and as per your logic output is 576 ,which is correct in general.
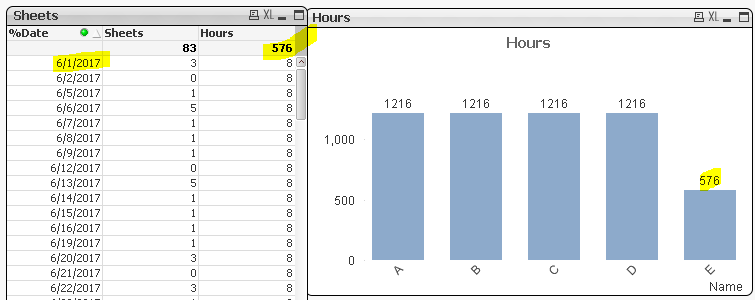
But client want to see Min(%Date) as 1/2/2017 first working day of 2017 and this is the year when Date has been entered against Sheet , so the actual output they looking for is 1440 all the time no matter even if I start my year from 2014.

Sorry for too much complications!
Regards,
AS
- Mark as New
- Bookmark
- Subscribe
- Mute
- Subscribe to RSS Feed
- Permalink
- Report Inappropriate Content
Hi Sunny,
Thanks once again!
They agreed to keep vStartDate as the date min date entered against sheet, so ur solution is working as expected.
Regards,
AS
- Mark as New
- Bookmark
- Subscribe
- Mute
- Subscribe to RSS Feed
- Permalink
- Report Inappropriate Content
Hi Sunny,
Can you please help here:
I'm calling simple expression on straight chart = NetWorkDays(Min(Date), Max(Date)) with Dimension= Name and below is result:

So sum total is 61 , which is correct , but why same expression is giving me 21 in text box , I didn't understand.
I want to see the same 61 output in text box.
Thanks in advance!
Regards,
AS
- Mark as New
- Bookmark
- Subscribe
- Mute
- Subscribe to RSS Feed
- Permalink
- Report Inappropriate Content
Can you attach the sample to check?
- « Previous Replies
- Next Replies »