Unlock a world of possibilities! Login now and discover the exclusive benefits awaiting you.
- Qlik Community
- :
- All Forums
- :
- QlikView App Dev
- :
- Expression with Aggr() calculates not for all rows...
- Subscribe to RSS Feed
- Mark Topic as New
- Mark Topic as Read
- Float this Topic for Current User
- Bookmark
- Subscribe
- Mute
- Printer Friendly Page
- Mark as New
- Bookmark
- Subscribe
- Mute
- Subscribe to RSS Feed
- Permalink
- Report Inappropriate Content
Expression with Aggr() calculates not for all rows in table chart
Hi all!
I have a following table chart:
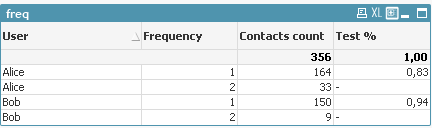
User is a field user_name;
Frequency is calculated dimension, which means a number of visits to contacts, made by user in period: Aggr(count(distinct visit_id), contact_id)
Contacts count is an expression. It shows how many contacts were visited with that frequency: count(distinct contact_id)
Test % should calculate % of contacts, visited with following frequency, of total number of contacts, visited by user. So, the result table should look like this:
| User | Frequency | Contacts count | Test % |
|---|---|---|---|
| A | 1 | 164 | 164/(164+33) = 0.83 |
| A | 2 | 33 | 33/(164+33) = 0.17 |
| B | 1 | 150 | 150/(150+9) = 0.94 |
| B | 2 | 9 | 9/(150+9) = 0.06 |
Now for Test % I use this expression:
count(distinct contact_id) / sum(Aggr(count(DISTINCT contact_id), user_id ))
And as you can see from first picture, it works only for one row per each user.
Is there a way to find this Test % for all calculated dimensions?
Sample data and qvw-file are attached.
Accepted Solutions
- Mark as New
- Bookmark
- Subscribe
- Mute
- Subscribe to RSS Feed
- Permalink
- Report Inappropriate Content
Try this instead
=Count(DISTINCT contact_id)/count(DISTINCT TOTAL <user_name> contact_id)
or this
=Count(DISTINCT contact_id)/Aggr(NODISTINCT Count(DISTINCT contact_id), user_id)

- Mark as New
- Bookmark
- Subscribe
- Mute
- Subscribe to RSS Feed
- Permalink
- Report Inappropriate Content
Try this instead
=Count(DISTINCT contact_id)/count(DISTINCT TOTAL <user_name> contact_id)
or this
=Count(DISTINCT contact_id)/Aggr(NODISTINCT Count(DISTINCT contact_id), user_id)
- Mark as New
- Bookmark
- Subscribe
- Mute
- Subscribe to RSS Feed
- Permalink
- Report Inappropriate Content
Thank you!