Unlock a world of possibilities! Login now and discover the exclusive benefits awaiting you.
- Qlik Community
- :
- All Forums
- :
- QlikView App Dev
- :
- Extreme of Selection, Disregard Dimension?
- Subscribe to RSS Feed
- Mark Topic as New
- Mark Topic as Read
- Float this Topic for Current User
- Bookmark
- Subscribe
- Mute
- Printer Friendly Page
- Mark as New
- Bookmark
- Subscribe
- Mute
- Subscribe to RSS Feed
- Permalink
- Report Inappropriate Content
Extreme of Selection, Disregard Dimension?
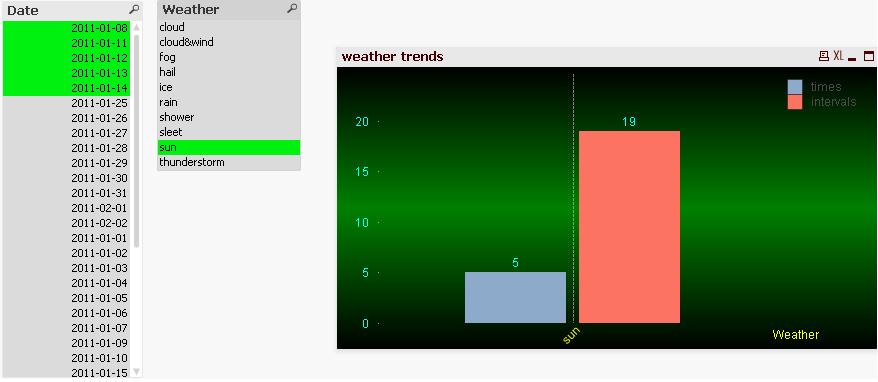
hi, there. In the chart below, with legend 'interval' I'd like to show, by the last date selected, how long hasn't a type of weather occurred.

For instance, I selected date ranges from 2011-01-01 to 2011-01-21, while total dates in the chart expanding from 2011-01-01 to 2011-02-05. So for 'sun', the 'interval' bar should display, by the end of 2011-01-21, there has been 7 days without a sunny day.
Who knows such expressions?
In the demo chart (results are wrong), I use max({1}Date)-max(Date).
Rgds
ALKshthsk
- « Previous Replies
-
- 1
- 2
- Next Replies »
Accepted Solutions
- Mark as New
- Bookmark
- Subscribe
- Mute
- Subscribe to RSS Feed
- Permalink
- Report Inappropriate Content
The mistake is that the expression max(date) is evaluated over the range of possible values. When you click the dimension, the possible values become just those with, say, sunny weather. Therefore you get max((sun)date) - max((sun) date) = 0.
To fix this, try setting vMaxDate to "=max({<Weather= >}date)" - in translation, the maximum of all Dates such that all selections to Weather are ignored.
- Mark as New
- Bookmark
- Subscribe
- Mute
- Subscribe to RSS Feed
- Permalink
- Report Inappropriate Content
Hello ALKshthsk,
I think your question will receive more responses if you could post it on the general QlikView development forum.
This is the QlikView Expressor forum which focues primarily on the QlikView Expressor Desktop and deployment.
Tyler
- Mark as New
- Bookmark
- Subscribe
- Mute
- Subscribe to RSS Feed
- Permalink
- Report Inappropriate Content
Thx, Tyler:
I'll try there now.
Rgds
- Mark as New
- Bookmark
- Subscribe
- Mute
- Subscribe to RSS Feed
- Permalink
- Report Inappropriate Content
Try Interval= max(date) - max({$<Weather={'Sun'}>}date).
- Mark as New
- Bookmark
- Subscribe
- Mute
- Subscribe to RSS Feed
- Permalink
- Report Inappropriate Content
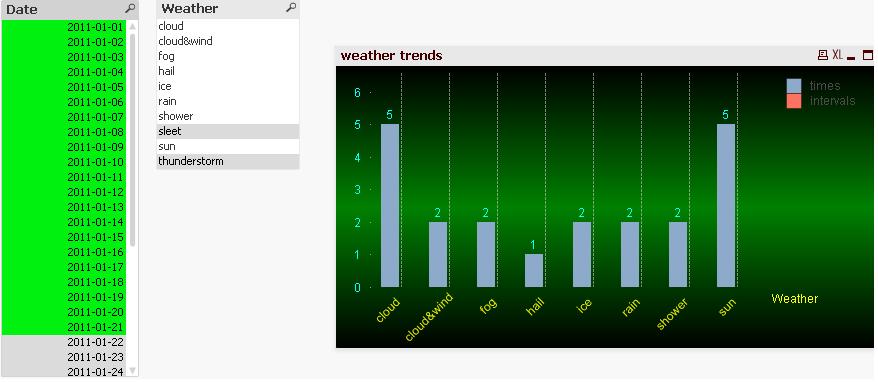
I input max(date) - max({$<Weather={'sun'}>}date). It's not working. The bar is now like this:
- Mark as New
- Bookmark
- Subscribe
- Mute
- Subscribe to RSS Feed
- Permalink
- Report Inappropriate Content
It looks like you have Weather as a dimension on your bar chart. This means that any calculations done in the chart will have weather already applied to them.
The way I suggested doing it would be to have 8 expressions, each with their own set expression, and no dimensions on the table. (you could then do count({$<Weather={'sun'}>}date) x8 to get your other expression.)
Alternately, you could use a global variable to set vMaxDate=max(date) and your expression would be $(vMaxDate) - max(date). The $() will return the value of max date, which is computed outside of the chart, and then you would subtract the max of each date that is computed inside the chart. I think that'd work, but I'd have to try it to check.
Hope this helps!
- Mark as New
- Bookmark
- Subscribe
- Mute
- Subscribe to RSS Feed
- Permalink
- Report Inappropriate Content
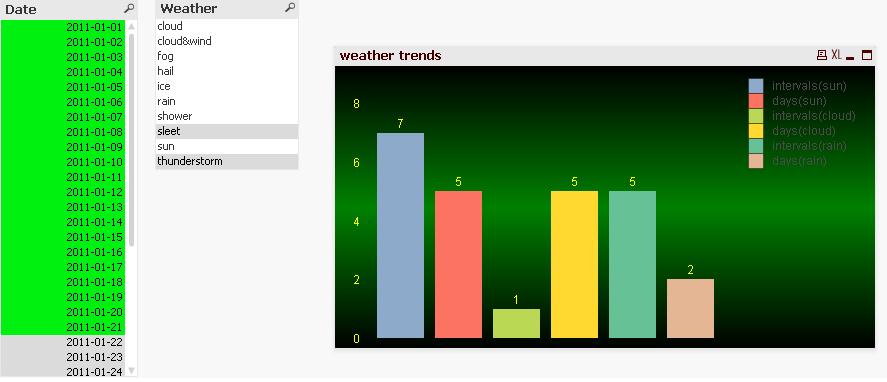
Hello,
The first method can make the figure. Only that I cannot find easy ways to set the similar expressions in bulk. Supposed dimensions are many, lots of efforts should be taken to finish settings. Another issue is the legend's label is not showing under each bar, that weakens the visualization of the charts.
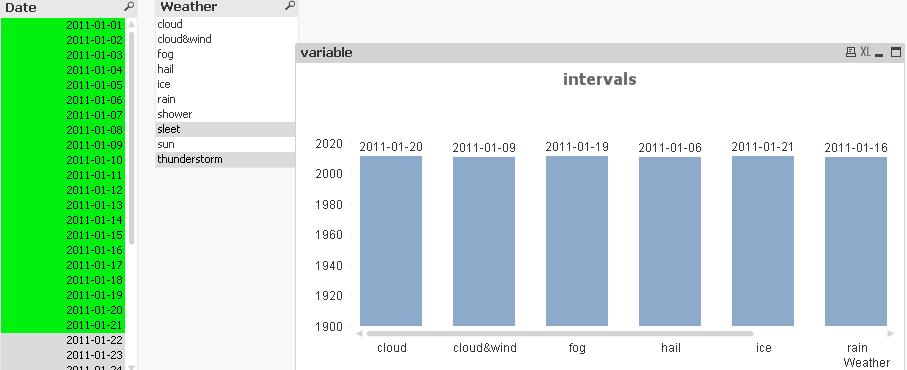
Also I tried the variable method. It seems the independently set variables are also bound by the dimensions. $(vMaxDate) seems equal to max(Date) here. The chart below uses $(vMaxDate) as expressions.
If needed, pls download my qvw: http://rapidshare.com/files/2551177690/weather.qvw I'd appreciate your better suggestions, or help to check if I've set as you said.
Thanks a ton.
- Mark as New
- Bookmark
- Subscribe
- Mute
- Subscribe to RSS Feed
- Permalink
- Report Inappropriate Content
I'm getting a 'download permission denied by uploader' on your .qvw.
With that said, I went into a QV app of my own that I had lying around and took a look at it and got it working.
I set vMaxDate = '=max(date)'. Putting the equals sign in the variable may be what you are missing.
With that done, $(vMaxDate) actually evaluated to 3 / 31 / 2013 aka 3 / (31*2013) and started giving me a date in 1899. So the actual equation should be:
= vMaxDate - max(date)
Without the dollar-sign expansion.
- Mark as New
- Bookmark
- Subscribe
- Mute
- Subscribe to RSS Feed
- Permalink
- Report Inappropriate Content
Great! Your help has put my project a big step forward. 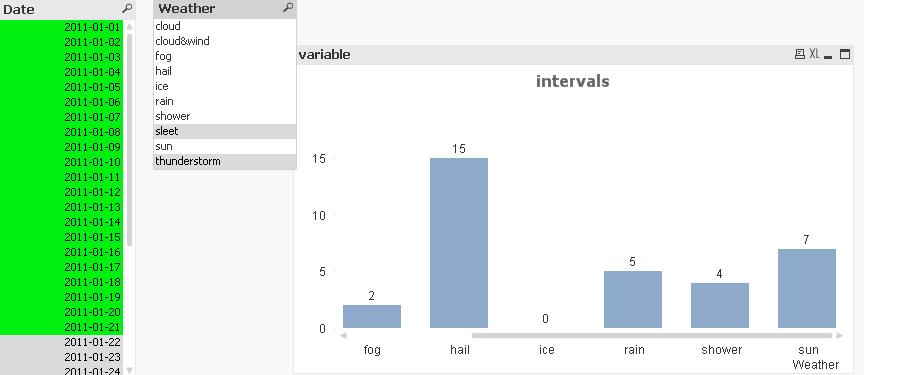
However, when I tried to click a single dimension, e.g. rain, sun. The bar value becomes 0.
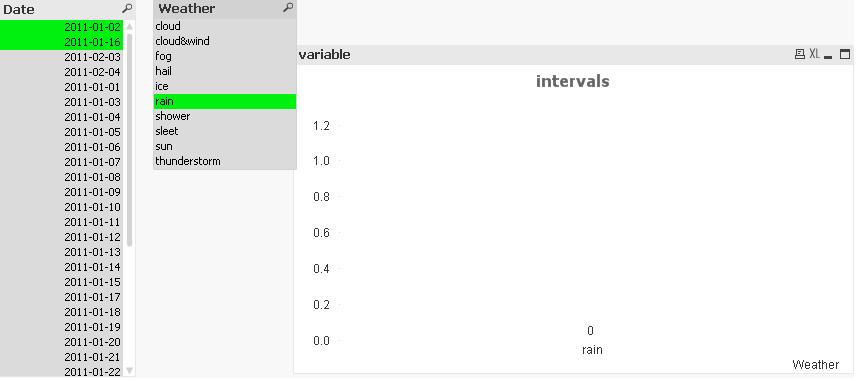
What is the possible mistake? Pls leave me your email, so I can send the file to you directly.
Thx
- Mark as New
- Bookmark
- Subscribe
- Mute
- Subscribe to RSS Feed
- Permalink
- Report Inappropriate Content
The mistake is that the expression max(date) is evaluated over the range of possible values. When you click the dimension, the possible values become just those with, say, sunny weather. Therefore you get max((sun)date) - max((sun) date) = 0.
To fix this, try setting vMaxDate to "=max({<Weather= >}date)" - in translation, the maximum of all Dates such that all selections to Weather are ignored.
- « Previous Replies
-
- 1
- 2
- Next Replies »