Unlock a world of possibilities! Login now and discover the exclusive benefits awaiting you.
- Qlik Community
- :
- All Forums
- :
- QlikView
- :
- Facets
- Subscribe to RSS Feed
- Mark Topic as New
- Mark Topic as Read
- Float this Topic for Current User
- Bookmark
- Subscribe
- Mute
- Printer Friendly Page
- Mark as New
- Bookmark
- Subscribe
- Mute
- Subscribe to RSS Feed
- Permalink
- Report Inappropriate Content
Facets
Hi Guru's,
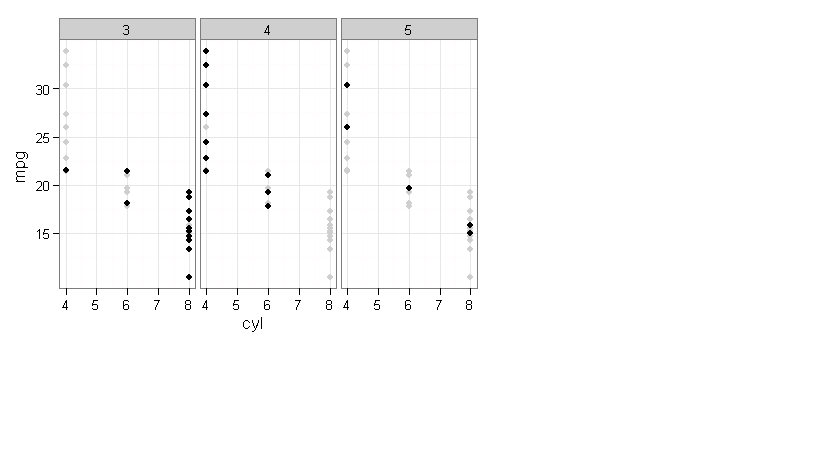
Is it possible to apply facets of my scatter chart like i have column called region each region have lot of plots,so i have to divide the plots and put it into each region like below screen shot.
Thanks,
Sateesh
- Tags:
- new_to_qlikview
Accepted Solutions
- Mark as New
- Bookmark
- Subscribe
- Mute
- Subscribe to RSS Feed
- Permalink
- Report Inappropriate Content
You can use the Trellis option (see Properties | Dimensions)
Define the scatter chart
Add Region as the first dimension (this will be consumed by the trellis option)
Enable trellis option
Optionally define number or rows /columns.
- Mark as New
- Bookmark
- Subscribe
- Mute
- Subscribe to RSS Feed
- Permalink
- Report Inappropriate Content
Have you tried using the TRELLIS option on the dimensions page of the OBJECT properties
Andy
- Mark as New
- Bookmark
- Subscribe
- Mute
- Subscribe to RSS Feed
- Permalink
- Report Inappropriate Content
Try a trellis chart (open dialog Trellis on dimension tab) which will use first dimension to create set of charts.
- Mark as New
- Bookmark
- Subscribe
- Mute
- Subscribe to RSS Feed
- Permalink
- Report Inappropriate Content
You can use the Trellis option (see Properties | Dimensions)
Define the scatter chart
Add Region as the first dimension (this will be consumed by the trellis option)
Enable trellis option
Optionally define number or rows /columns.
- Mark as New
- Bookmark
- Subscribe
- Mute
- Subscribe to RSS Feed
- Permalink
- Report Inappropriate Content
Thank you Jonathan.
- Mark as New
- Bookmark
- Subscribe
- Mute
- Subscribe to RSS Feed
- Permalink
- Report Inappropriate Content
Thanks swuehl
- Mark as New
- Bookmark
- Subscribe
- Mute
- Subscribe to RSS Feed
- Permalink
- Report Inappropriate Content
Thanks Andrew