Unlock a world of possibilities! Login now and discover the exclusive benefits awaiting you.
- Qlik Community
- :
- All Forums
- :
- QlikView App Dev
- :
- Re: Fill Time gaps - reference table issue
- Subscribe to RSS Feed
- Mark Topic as New
- Mark Topic as Read
- Float this Topic for Current User
- Bookmark
- Subscribe
- Mute
- Printer Friendly Page
- Mark as New
- Bookmark
- Subscribe
- Mute
- Subscribe to RSS Feed
- Permalink
- Report Inappropriate Content
Fill Time gaps - reference table issue
Hi everyone,
I am trying to come up with a solution that will fill time gaps in my chart. I tried and tested the approach where I create a reference table that contains all of the desired values.
For example, if my fact table has:
HourMinute, Value
'10:30', 55,
'11:00', 150,
And I want to also show 10:45 in my graph then I create a reference table like the one below and I select Shift instead
DayShift, HourMinute
'Early', '10:30'
'Early', '10:45'
'Early', '11:00'
This works really well except when there are multiple reference tables.
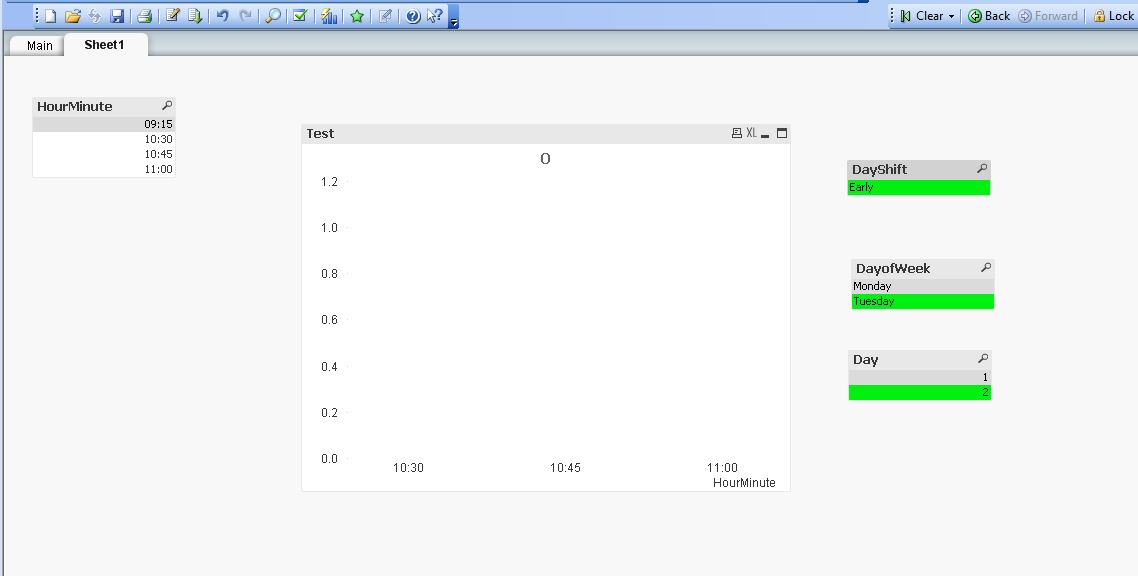
For example if to the example above we add another reference table, call it Calendar that defines day of week. If in addition to select DayShift we also select Day and/or Day of week, the graph will stop displaying the missing value (i.e. 10:45).
Please see the QlikView file example attached.
Please also see the screenshot attached. Can I find a way to display 10:45 in the graph?
Is there any of still filling in the 10:45 even when selecting Day/Day of week? Many thanks in advance
Fact_Table:
Load * INLINE [
HourMinute, Value2, Day
'09:15', 11, 1
'10:30', 55, 1
'11:00', 150, 1
'10:30', 55, 2
'11:00', 150, 2
];
HourCalendar:
LOAD * Inline [
DayShift, HourMinute
'Early', '10:30'
'Early', '10:45'
'Early', '11:00'
];
Calendar:
LOAD * inline [
Day, DayofWeek,
1, Monday
2, Tuesday
];
 !
!
- Tags:
- time_series
- Mark as New
- Bookmark
- Subscribe
- Mute
- Subscribe to RSS Feed
- Permalink
- Report Inappropriate Content
Maybe like attached?
- Mark as New
- Bookmark
- Subscribe
- Mute
- Subscribe to RSS Feed
- Permalink
- Report Inappropriate Content
Hi,
That is definitely a step forward. However, when I make the following selections the values displayed on the graph are not correct. Do you know what can be tweaked to make it work?
- Mark as New
- Bookmark
- Subscribe
- Mute
- Subscribe to RSS Feed
- Permalink
- Report Inappropriate Content
Please have a look at attached file.