Unlock a world of possibilities! Login now and discover the exclusive benefits awaiting you.
- Qlik Community
- :
- All Forums
- :
- QlikView App Dev
- :
- Filtering on an Expression column on a pivot table
- Subscribe to RSS Feed
- Mark Topic as New
- Mark Topic as Read
- Float this Topic for Current User
- Bookmark
- Subscribe
- Mute
- Printer Friendly Page
- Mark as New
- Bookmark
- Subscribe
- Mute
- Subscribe to RSS Feed
- Permalink
- Report Inappropriate Content
Filtering on an Expression column on a pivot table
Hello Qlik Community,
So I created a pivot table and have a few dimension and expression columns that are currently being displayed.
For one of my expression columns, I set a condition where certain values will come up as 1, others as 2. What I want to do is filter that expression coumn so that only the rows that have 1 in the specified column will show up. I do not want the records that return 2 in that column to appear.
Overall, how do I filter on an expression column so that only the rows that show 1 will appear?
Please let me know if any specifics are needed in terms of expamples. I can provide examples if requested.
Thanks in advance,
Tej
- « Previous Replies
-
- 1
- 2
- Next Replies »
- Mark as New
- Bookmark
- Subscribe
- Mute
- Subscribe to RSS Feed
- Permalink
- Report Inappropriate Content
Can you provide a sample example or an app with an expected output please ??
- Mark as New
- Bookmark
- Subscribe
- Mute
- Subscribe to RSS Feed
- Permalink
- Report Inappropriate Content
Hello Vish,
Sure. Here is an example below:

This is a screenshot of the column. The expression for the column is: =IF(Aggr(DISTINCT Count(NUM),NAME,ID,DT)>1,1,0) + IF(Aggr(DISTINCT Count(DT),NAME,ID,NUM)>1,1,0).
So in this column, I would like to apply a filter or maybe an expression to the pivot table so that ONLY '1's will show up on the column, and the '2's will not be shown.
I hope this helps.
Thanks,
Tej
- Mark as New
- Bookmark
- Subscribe
- Mute
- Subscribe to RSS Feed
- Permalink
- Report Inappropriate Content
IS it possible to share a sample app please ??
- Mark as New
- Bookmark
- Subscribe
- Mute
- Subscribe to RSS Feed
- Permalink
- Report Inappropriate Content
Vish,
Unfortunately this is all I can share at the moment. Any suggestions or even vague comments as to what functionality I may need to use to accomplish this task would be good enough as well. I just request some direction as to what function or expression to use and I would be able to figure it out from there.
Hope this helps.
Best,
Tej
- Mark as New
- Bookmark
- Subscribe
- Mute
- Subscribe to RSS Feed
- Permalink
- Report Inappropriate Content
why don't you add this condition in set analysis of your measures?
Or Create a flag in your load script to simplify this calculated dimension
If a post helps to resolve your issue, please accept it as a Solution.
- Mark as New
- Bookmark
- Subscribe
- Mute
- Subscribe to RSS Feed
- Permalink
- Report Inappropriate Content
Add another iF!
if(IF(Aggr(DISTINCTCount(NUM),NAME,ID,DT)>1,1,0) + IF(Aggr(DISTINCT Count(DT),NAME,ID,NUM)>1,1,0)=1,1,null())
and check suppress when value is null
If a post helps to resolve your issue, please accept it as a Solution.
- Mark as New
- Bookmark
- Subscribe
- Mute
- Subscribe to RSS Feed
- Permalink
- Report Inappropriate Content
Try this
=if (IF(Aggr(DISTINCT Count(NUM),NAME,ID,DT)>1,1,0) +IF(Aggr(DISTINCT Count(DT),NAME,ID,NUM)>1,1,0))=1,1)
Or try
=IF(Aggr(DISTINCT Count(NUM),NAME,ID,DT)>1 XOR Aggr(DISTINCT Count(DT),NAME,ID,NUM)>1,1).
- Mark as New
- Bookmark
- Subscribe
- Mute
- Subscribe to RSS Feed
- Permalink
- Report Inappropriate Content
Hello Vineeth,
Thanks for your reply! I used the expression you provided and it worked out in only showing the 1s in that column, but do you think I will be able to take it a step further?
Instead of just keeping the 1s in that one column, I was hoping it would keep the whole row where the 1 appears. I think I can better explain this through example:
ID Date Num REST
1 8/5 678 1
2 8/6 917 2
3 8/7 325 2
4 8/8 983 2
5 8/9 53 2
So I have the data set above. What I initally asked was to only show the records where REST =1, which you solved, but I want the whole row with the '1' to show up, so that the data will be brought down to the example below:
ID Date Num REST
1 8/5 678 1
Not only do I need to column REST to show only the '1's, but I need the whole row that contains the 1 to show up. I hope this further explains what I wish to accomplish. Again, this would be of tremendous help to me.
Thank you,
Tej
- Mark as New
- Bookmark
- Subscribe
- Mute
- Subscribe to RSS Feed
- Permalink
- Report Inappropriate Content
OK. Why are you creating a pivot table?? what is/are your Expressions?
you could simply add the other fields to the pivot
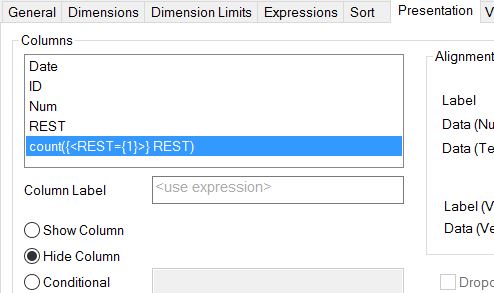
if you only want to show a data table , use a Straight table as below
Dimensions: ID , Date,Num,Rest
Expression: count({<REST={1}>} REST)
and on the Presentation tab >> Select your expression column and hide it.
If a post helps to resolve your issue, please accept it as a Solution.
- « Previous Replies
-
- 1
- 2
- Next Replies »