Unlock a world of possibilities! Login now and discover the exclusive benefits awaiting you.
- Qlik Community
- :
- All Forums
- :
- QlikView App Dev
- :
- Fix column in a diagramm sum table
- Subscribe to RSS Feed
- Mark Topic as New
- Mark Topic as Read
- Float this Topic for Current User
- Bookmark
- Subscribe
- Mute
- Printer Friendly Page
- Mark as New
- Bookmark
- Subscribe
- Mute
- Subscribe to RSS Feed
- Permalink
- Report Inappropriate Content
Fix column in a diagramm sum table
Hello together,
i have problems with a Diagramm Table Sum.
In the following you see the filtes of the table:
| Year |
|---|
| 2014 |
| 2013 |
| Nature |
|---|
| Actual |
Forecast I |
| Forecast II |
| Last year |
Month | Month | Month | Month |
|---|---|---|---|
| 1 | 2 | 3 | 4 |
| 5 | 6 | 7 | 8 |
| 9 | 10 | 11 | 12 |
Here you see the Diagramm Tabel Sum
| Actual | Forecast | Last Year | |
|---|---|---|---|
| Revenue | it should Show always the actual figures (filter of | it should choicable for the Forecast I oder II | it should Show always the last year filter |
| Forecast | it works | ||
| Gross Margin |
I Need help of the columns. The first colum works, if I click a other filter (eg. Forecast 1) it Shows the actual. But in the second column it Shows me the choicable Filter (eg. last year, forecast I or forecast II).
How can I fix the forecast column to Show me only forecast I or forecast II?
How can I fix the Last year column, that it Shows me always the Last Year Filter.
Does anyone can help me.
Thanks.
Jörn
- Tags:
- qlikview_scripting
Accepted Solutions
- Mark as New
- Bookmark
- Subscribe
- Mute
- Subscribe to RSS Feed
- Permalink
- Report Inappropriate Content
- Mark as New
- Bookmark
- Subscribe
- Mute
- Subscribe to RSS Feed
- Permalink
- Report Inappropriate Content
Actual: sum({<Nature={'Actual'}>}Value)
Forecast: sum({<Nature={'$(=only(Nature))'}*{'For*'}>}Value)
Last Year: sum({<Nature={'Last Year'}>}Value)
talk is cheap, supply exceeds demand
- Mark as New
- Bookmark
- Subscribe
- Mute
- Subscribe to RSS Feed
- Permalink
- Report Inappropriate Content
Thank you for this quick Response.
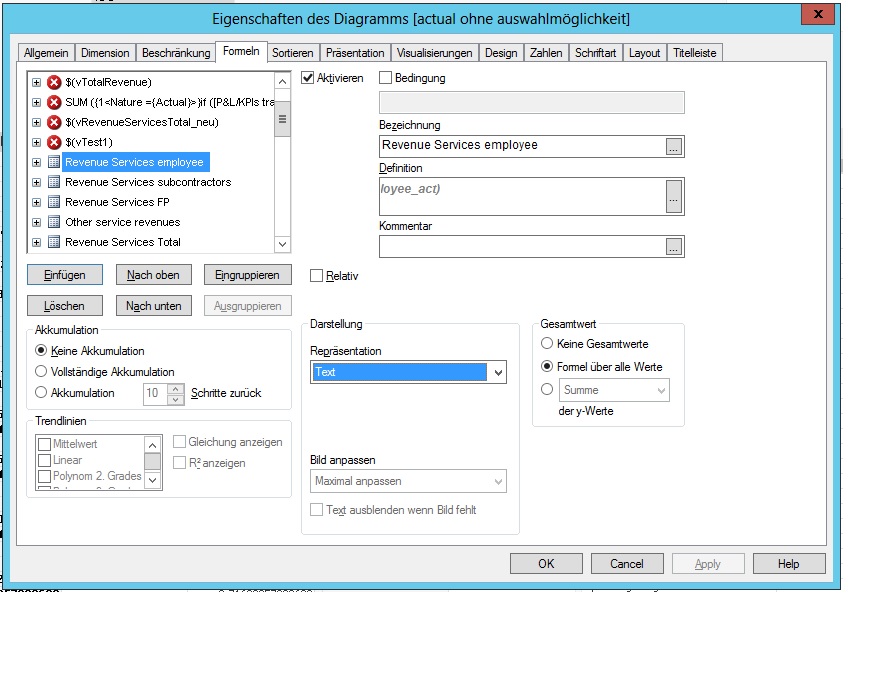
How I get this three formulas in the Formula field

Do I Need a Conditional in the field.
Thank you.
- Mark as New
- Bookmark
- Subscribe
- Mute
- Subscribe to RSS Feed
- Permalink
- Report Inappropriate Content
See attached example.
talk is cheap, supply exceeds demand