Unlock a world of possibilities! Login now and discover the exclusive benefits awaiting you.
- Qlik Community
- :
- All Forums
- :
- QlikView App Dev
- :
- Formating the Chart's figures by K or Million
- Subscribe to RSS Feed
- Mark Topic as New
- Mark Topic as Read
- Float this Topic for Current User
- Bookmark
- Subscribe
- Mute
- Printer Friendly Page
- Mark as New
- Bookmark
- Subscribe
- Mute
- Subscribe to RSS Feed
- Permalink
- Report Inappropriate Content
Formating the Chart's figures by K or Million
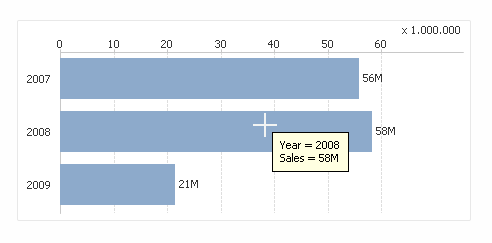
Hi, how do we control the numbers to present as thousands (K) or Millions (M) in a chart? I tried to do that in the chart properties under the numbers options, but couldn't figure out.
Image below was the original figures:
Image below is the result AFTER I put in the Million Symbol, hoping the figures in the chart shrinks down by 6 digits, but it remains same. In fact, it would be great if the label can present as 0.9M or -5.7M or 16M or -6.3M, all rounded by 1 decimal place. Possible?
- Mark as New
- Bookmark
- Subscribe
- Mute
- Subscribe to RSS Feed
- Permalink
- Report Inappropriate Content
maybe using a dual in expression and formatas Expression default
dual(num(Sum (Sales / $(vCurrency))/1000000, '#,##0M'),
Sum (Sales / $(vCurrency)))

- Mark as New
- Bookmark
- Subscribe
- Mute
- Subscribe to RSS Feed
- Permalink
- Report Inappropriate Content
Hello Massimo, thank you for the advice. I tried but couldn't get it to work though. Didn't know it's so difficult to adjust the currency representation in Qlikview, this is so frustrating, considering it couldbe done easily in excel and tableau.