Unlock a world of possibilities! Login now and discover the exclusive benefits awaiting you.
- Qlik Community
- :
- All Forums
- :
- QlikView App Dev
- :
- Re: Formatting DATE Field (YYYY-MM-DD :hh:mm:SS) i...
- Subscribe to RSS Feed
- Mark Topic as New
- Mark Topic as Read
- Float this Topic for Current User
- Bookmark
- Subscribe
- Mute
- Printer Friendly Page
- Mark as New
- Bookmark
- Subscribe
- Mute
- Subscribe to RSS Feed
- Permalink
- Report Inappropriate Content
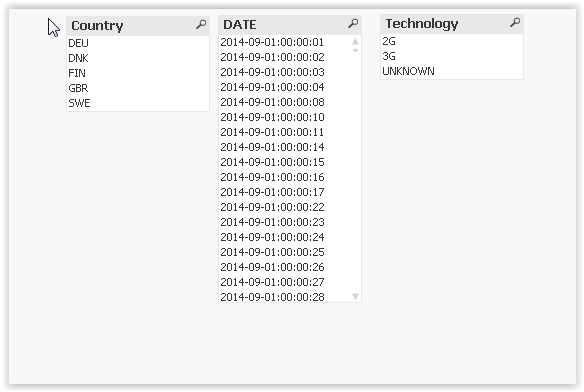
Formatting DATE Field (YYYY-MM-DD :hh:mm:SS) into two separate fields Date (yyyy-mm-dd) and time (hh:mm:ss)??
Dear community users
Can anyone suggest how do i format my Date field which is originally in this format (YYYY-MM-DD:hh:mm:SS) into two separate list boxes named Date and time?
my script is:
LOAD @1 as Country,
@5 as DATE,
@6 as Duration,
@11 as Technology
FROM
(txt, codepage is 1252, no labels, delimiter is ',', msq);
- Tags:
- qlikview_scripting
- « Previous Replies
-
- 1
- 2
- Next Replies »
- Mark as New
- Bookmark
- Subscribe
- Mute
- Subscribe to RSS Feed
- Permalink
- Report Inappropriate Content
Hi,
one solution could be:
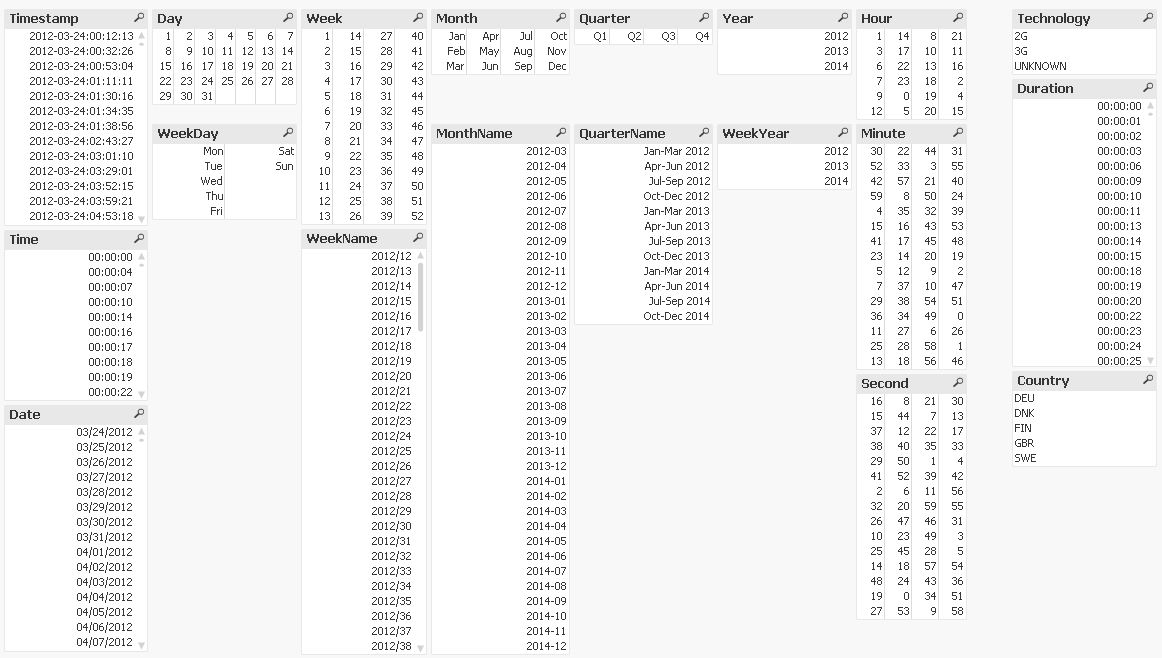
tabConnections:
LOAD *,
     Time(Frac(Timestamp)) as Time,
     DayName(Timestamp) as Date,
     Minute(Timestamp) as Minute,
     Second(Timestamp) as Second,
     Hour(Timestamp) as Hour,
     Day(Timestamp) as Day,
     WeekDay(Timestamp) as WeekDay,
     Week(Timestamp) as Week,
     WeekName(Timestamp) as WeekName,
     Month(Timestamp) as Month,
     Date(MonthName(Timestamp),'YYYY-MM') as MonthName,
     Dual('Q'&Ceil(Month(Timestamp)/3),Ceil(Month(Timestamp)/3)) as Quarter,
     QuarterName(Timestamp) as QuarterName,
     Year(Timestamp) as Year,
     WeekYear(Timestamp) as WeekYear;
LOAD @1 as Country,
     Timestamp#(@5,'YYYY-MM-DD:hh:mm:ss') as Timestamp,
     @6 as Duration,
     @11 as Technology
FROM [http://community.qlik.com/servlet/JiveServlet/download/683298-142429/QlikCommunity_Thread_146201.csv] (txt, codepage is 1252, no labels, delimiter is ',', msq);
hope this helps
regards
Marco
- Mark as New
- Bookmark
- Subscribe
- Mute
- Subscribe to RSS Feed
- Permalink
- Report Inappropriate Content
Hi Ravi, try like this:
In script:
LOAD @1 as Country,
Date(timestamp#(@5,'YYYY-MM-DD:hh:mm:SS'),'YYYY-MM') as Date,
time(timestamp#(@5,'YYYY-MM-DD:hh:mm:SS')) as Time,
@6 as Duration,
@11 as Technology
FROM
(txt, codepage is 1252, no labels, delimiter is ',', msq);
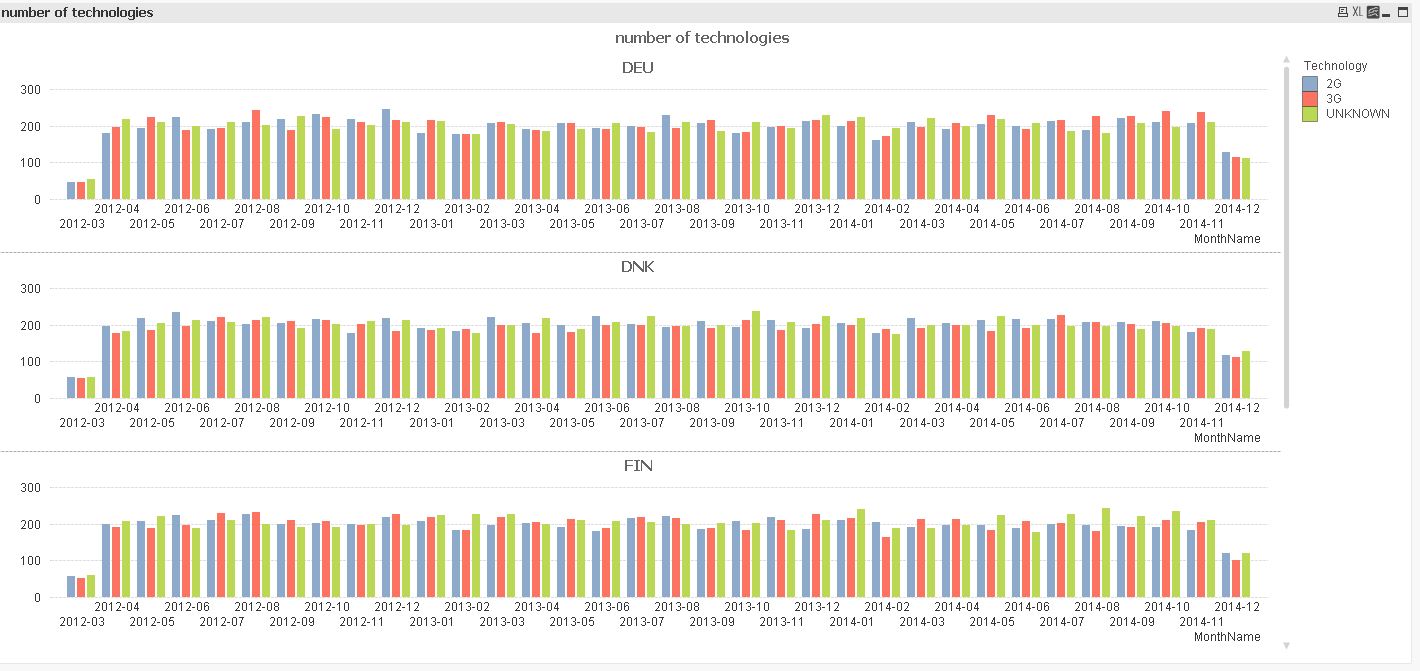
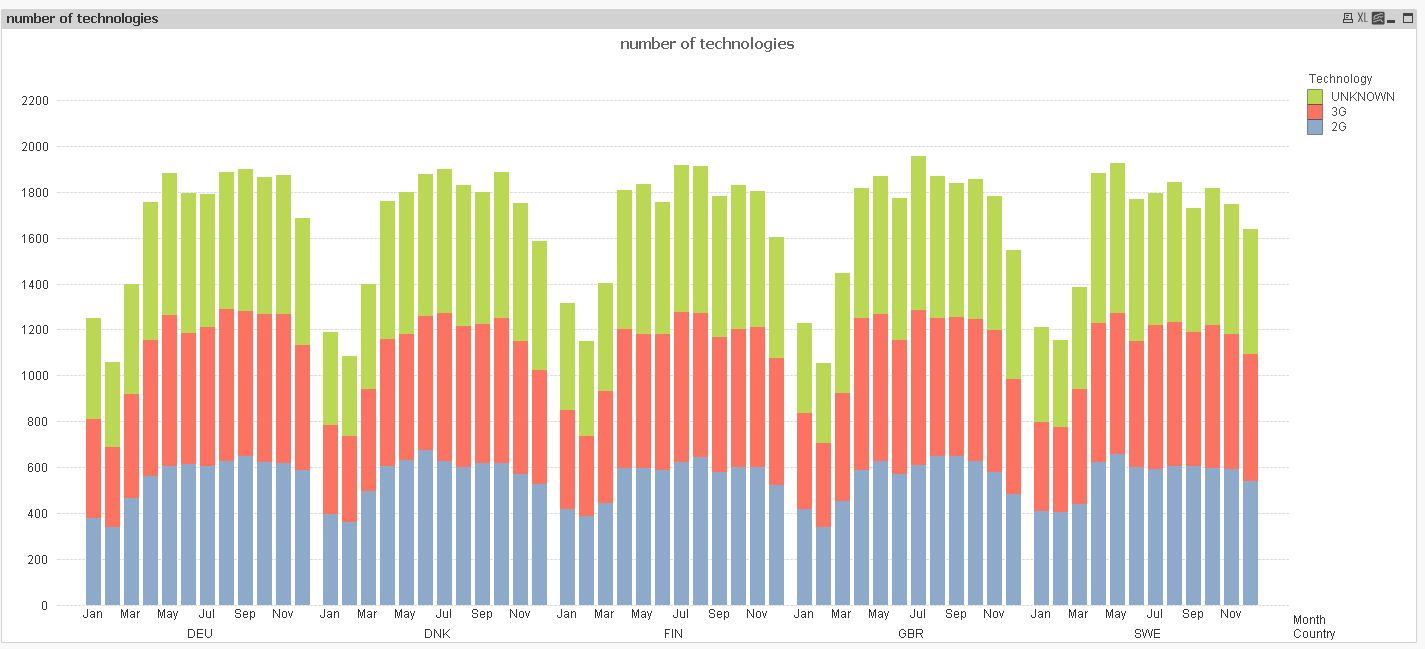
Now in front end create a bar chart:
In dimension:
Take month.
Inexpression:
1. count({<Technology={'2G'}>}Technology)
2.count({<Technology={'3G'}>}Technology)
Hope it helps:
Regards
KC
KC
- « Previous Replies
-
- 1
- 2
- Next Replies »