Unlock a world of possibilities! Login now and discover the exclusive benefits awaiting you.
- Qlik Community
- :
- All Forums
- :
- QlikView App Dev
- :
- Formulas in Charts doesn't show correct value
- Subscribe to RSS Feed
- Mark Topic as New
- Mark Topic as Read
- Float this Topic for Current User
- Bookmark
- Subscribe
- Mute
- Printer Friendly Page
- Mark as New
- Bookmark
- Subscribe
- Mute
- Subscribe to RSS Feed
- Permalink
- Report Inappropriate Content
Formulas in Charts doesn't show correct value
Hello,
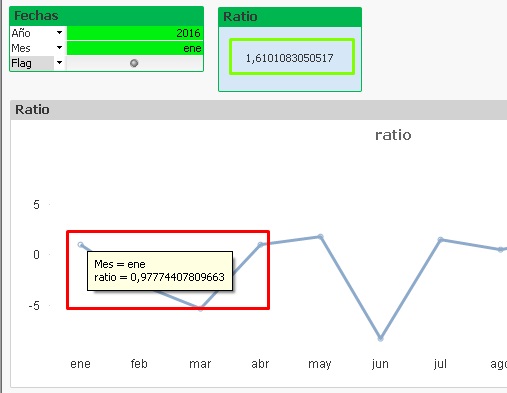
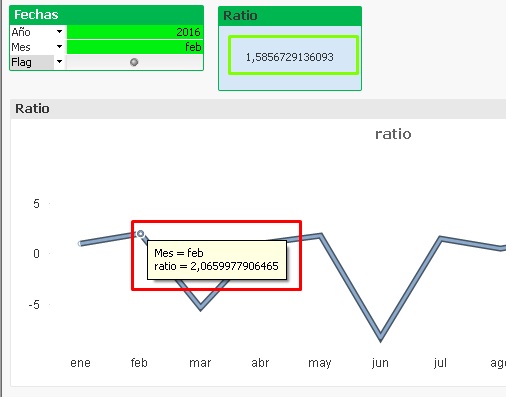
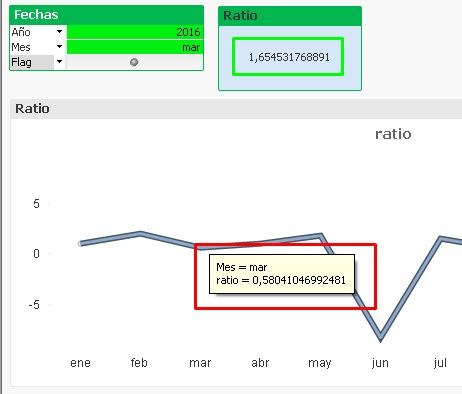
I am trying to show a formula value in chart, but it doesn't show corect value.
Y have a "Month" as Dimension, and a formula as Expession.
The formula in a text object shows the correct value making any filter. But in chat changes values and graph.
Example for the "current ratio":
Jan: 1.61

Feb: 1.58

Mar: 1.65

- « Previous Replies
-
- 1
- 2
- Next Replies »
- Mark as New
- Bookmark
- Subscribe
- Mute
- Subscribe to RSS Feed
- Permalink
- Report Inappropriate Content
Hello,
No, the value in both the TB and Char should the the same as the TB shows.
I solved this problems.
I am trying to get a relation between two cumulative values but using Formula in chart and TB. So, the problems was there. The range in the formula is confused when I use 'month' as dimension.
I accumulated values in the QVD file and I use the same formula but without the range.
- Mark as New
- Bookmark
- Subscribe
- Mute
- Subscribe to RSS Feed
- Permalink
- Report Inappropriate Content
So everything is working now?
- Mark as New
- Bookmark
- Subscribe
- Mute
- Subscribe to RSS Feed
- Permalink
- Report Inappropriate Content
Yes it is, thank you for you help.
I used this formula:
sum({<BalanceFinal.nvl1 = {'10'}, BalanceFinal.nvl2 = {'10'}>}BalanceFinal.Monto1)
/
(sum({<BalanceFinal.nvl1 = {'20'}, BalanceFinal.nvl2 = {'30'}>}BalanceFinal.Monto1)*-1)
The chart is about the current year.

- Mark as New
- Bookmark
- Subscribe
- Mute
- Subscribe to RSS Feed
- Permalink
- Report Inappropriate Content
Great ![]()
I am glad we all were able to help you in some way or the other
- « Previous Replies
-
- 1
- 2
- Next Replies »