Unlock a world of possibilities! Login now and discover the exclusive benefits awaiting you.
- Qlik Community
- :
- All Forums
- :
- QlikView App Dev
- :
- Re: Full accumulation - Stop bar after current mon...
- Subscribe to RSS Feed
- Mark Topic as New
- Mark Topic as Read
- Float this Topic for Current User
- Bookmark
- Subscribe
- Mute
- Printer Friendly Page
- Mark as New
- Bookmark
- Subscribe
- Mute
- Subscribe to RSS Feed
- Permalink
- Report Inappropriate Content
Full accumulation - Stop bar after current month
Hi
I have a chart presenting an accumulation of amount on Year N and N-1.
But for the current year I don't want my accumulation to appear after the last month of data.
Knowing that my data are stopped at March 31st 2018.

Any idea ?
regards
- Tags:
- full_accumulation
Accepted Solutions
- Mark as New
- Bookmark
- Subscribe
- Mute
- Subscribe to RSS Feed
- Permalink
- Report Inappropriate Content
Hi Laure,
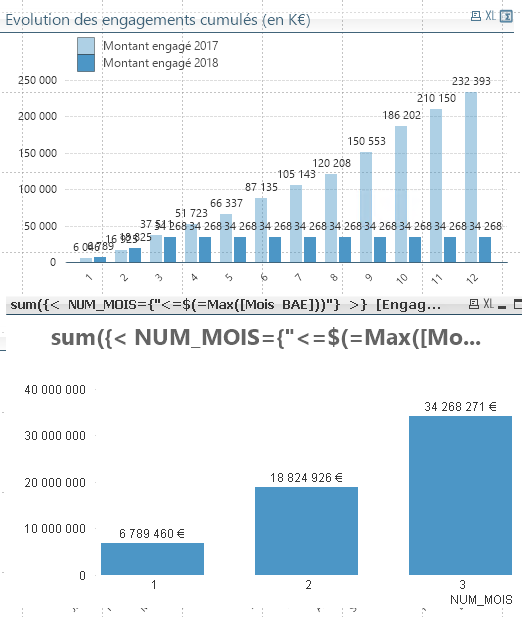
Pls. see the attached files. Also note, that I have defined 2 variables which are used in the set-formula.
Rgds. Anders
- Mark as New
- Bookmark
- Subscribe
- Mute
- Subscribe to RSS Feed
- Permalink
- Report Inappropriate Content
hello
maybe specifying a limit on current month in a set analysis
sommenting like : year={'Current Year'],month={'<=current month'} ?
- Mark as New
- Bookmark
- Subscribe
- Mute
- Subscribe to RSS Feed
- Permalink
- Report Inappropriate Content
Hi
It works but if I'm displaying only the current year.
By showing last year, all the months are displayed so I think that's why it continues the accumulation on the following months.

- Mark as New
- Bookmark
- Subscribe
- Mute
- Subscribe to RSS Feed
- Permalink
- Report Inappropriate Content
and if you try something like this
sum( ... if(month<=current month),value,0) ?
- Mark as New
- Bookmark
- Subscribe
- Mute
- Subscribe to RSS Feed
- Permalink
- Report Inappropriate Content
Hi
No it didn't work 😞
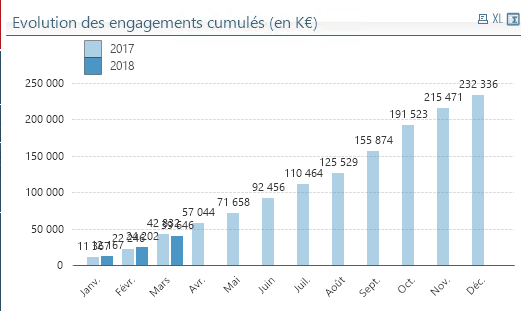
Maybe it's not possible if there are other values on the chart.. because without N-1 it works :

but with N-1 :

- Mark as New
- Bookmark
- Subscribe
- Mute
- Subscribe to RSS Feed
- Permalink
- Report Inappropriate Content
Hey Denivelle,
Recently I had the same problem...
Only one working solution I came up with was playing with colors in the chart.
So you will want to make conditional coloring for current year expression ... make it white and transparent if month is > then current month.
Hope this partial solution helps ![]()
- Mark as New
- Bookmark
- Subscribe
- Mute
- Subscribe to RSS Feed
- Permalink
- Report Inappropriate Content
Hi Laure,
Pls. see the attached files. Also note, that I have defined 2 variables which are used in the set-formula.
Rgds. Anders
- Mark as New
- Bookmark
- Subscribe
- Mute
- Subscribe to RSS Feed
- Permalink
- Report Inappropriate Content
Hi Anders
Yes ! it works !

Thank you ![]()
- Mark as New
- Bookmark
- Subscribe
- Mute
- Subscribe to RSS Feed
- Permalink
- Report Inappropriate Content
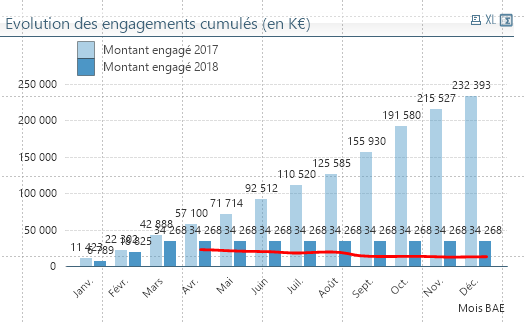
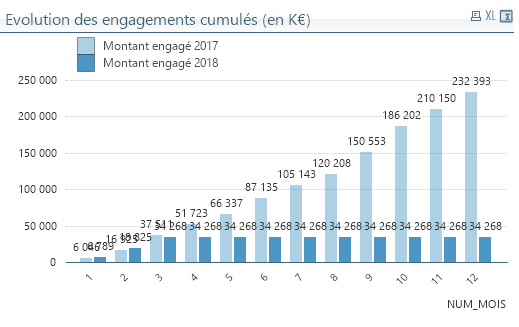
Hi
It's working but I can't find a way to remove the expression values on the chart for the following months :
