Unlock a world of possibilities! Login now and discover the exclusive benefits awaiting you.
- Qlik Community
- :
- All Forums
- :
- QlikView App Dev
- :
- Gantt Chart - Hide Extra Dimension?
Options
- Subscribe to RSS Feed
- Mark Topic as New
- Mark Topic as Read
- Float this Topic for Current User
- Bookmark
- Subscribe
- Mute
- Printer Friendly Page
Turn on suggestions
Auto-suggest helps you quickly narrow down your search results by suggesting possible matches as you type.
Showing results for
Specialist II
2016-11-02
03:52 PM
- Mark as New
- Bookmark
- Subscribe
- Mute
- Subscribe to RSS Feed
- Permalink
- Report Inappropriate Content
Gantt Chart - Hide Extra Dimension?
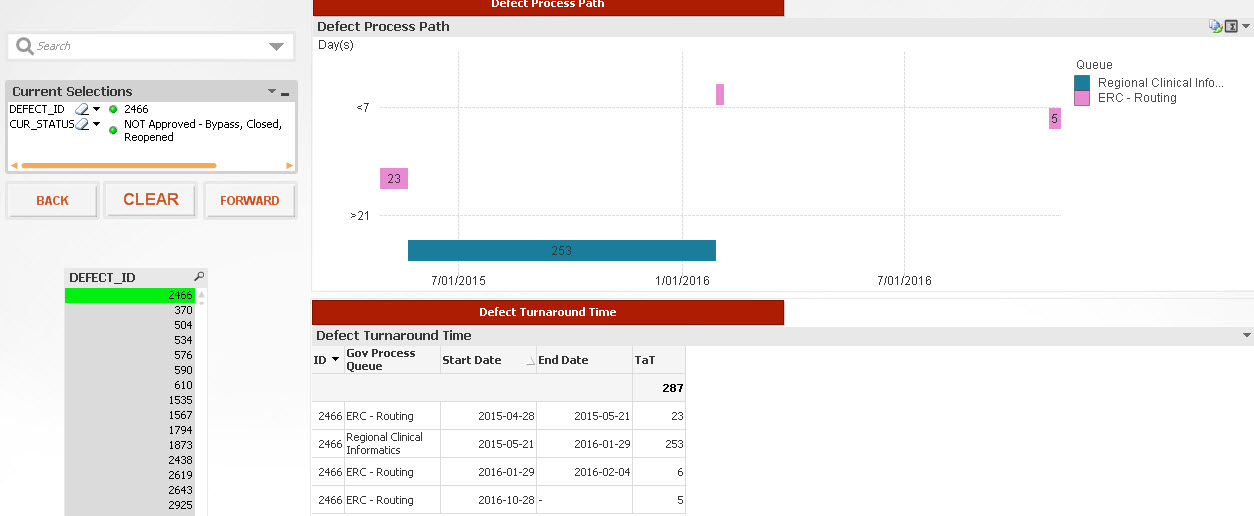
I have this cool view via a Gantt chart to look at a single ticket's journey. It includes class buckets to indicate the number of days in each step. It looks like this when selecting DEFECT_ID 2466:

The problem, however, is visible if you click on a Queue step like ERC - Routing. As you can see highlighted in yellow, one of my dimensions DEFECT_GPQ_START is showing instead of the 7 day buckets. How do I get this field to not display on my chart but remain as a dimension to maintain the functionality? I still want to see the <7, >21 etc class buckets on the y-axis.

thanks!
449 Views
0 Replies