Unlock a world of possibilities! Login now and discover the exclusive benefits awaiting you.
- Qlik Community
- :
- All Forums
- :
- QlikView App Dev
- :
- Gauge Chart with 3 segments with color gradients
- Subscribe to RSS Feed
- Mark Topic as New
- Mark Topic as Read
- Float this Topic for Current User
- Bookmark
- Subscribe
- Mute
- Printer Friendly Page
- Mark as New
- Bookmark
- Subscribe
- Mute
- Subscribe to RSS Feed
- Permalink
- Report Inappropriate Content
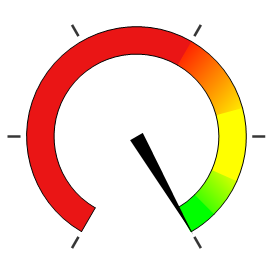
Gauge Chart with 3 segments with color gradients
Hi People,
I have a problem connected with gauge chart in QV (please see the attachment).
I want to have that from 0 to 75 % have a dark red which it would be changing to yellow, from 75 to 100 from yellow to dark green and above 100 % from dark green to light green.
The problem is how to set up colour gradients to show them fluently passing from one segment to another like in the second image attached to this post.
Maybe some of you had a similar problem?
All answers are welcome 
Thank you in advance!
Best Regards,
Jacek Antek
- Mark as New
- Bookmark
- Subscribe
- Mute
- Subscribe to RSS Feed
- Permalink
- Report Inappropriate Content
What you want is not possible with that kind of gauge. You can try a lineair gauge. The example below has two segments with two-color gradients as background colors.

talk is cheap, supply exceeds demand
- Mark as New
- Bookmark
- Subscribe
- Mute
- Subscribe to RSS Feed
- Permalink
- Report Inappropriate Content
Hi jaryszek2
You can find some useful tips here:
https://community.qlik.com/docs/DOC-8725
QlikView Design - Gauge Chart Tip and Trick
Dual gauge realistic examples - especially here 🙂
- Mark as New
- Bookmark
- Subscribe
- Mute
- Subscribe to RSS Feed
- Permalink
- Report Inappropriate Content
You could do this with more ranges in the gauge and maybe also playing with colour gradients in the segments:
- Mark as New
- Bookmark
- Subscribe
- Mute
- Subscribe to RSS Feed
- Permalink
- Report Inappropriate Content
Thank you for your answers.
I think that regarding more ranges in the gauge - you can see further color differences within segments jonathan dienst.
Daniel Kusiak - Dziękuje za tematy (thank you for links!:)
Gysbert Wassenaar- I think that linear gauge would be better then 3 different segments.