Unlock a world of possibilities! Login now and discover the exclusive benefits awaiting you.
- Qlik Community
- :
- All Forums
- :
- QlikView App Dev
- :
- Re: Gauge chart
- Subscribe to RSS Feed
- Mark Topic as New
- Mark Topic as Read
- Float this Topic for Current User
- Bookmark
- Subscribe
- Mute
- Printer Friendly Page
- Mark as New
- Bookmark
- Subscribe
- Mute
- Subscribe to RSS Feed
- Permalink
- Report Inappropriate Content
Gauge chart
Friends,
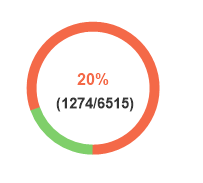
I want a circular gauge chart showing KPI value and the actual value as shown in below screenshot,

But in this chart, month wise KPI values need to be shown. If I filter month and year, it has to change accordingly. Plz help..
- Mark as New
- Bookmark
- Subscribe
- Mute
- Subscribe to RSS Feed
- Permalink
- Report Inappropriate Content
Is this you are expecting? Few setting required to show same Chart. Even sorting is running the Data point will changed
You can change below Setting with Sum(Sales) expression
And For Text of Number i've used this. Text in chart from Presentation Tab(For Ref, Check above image)
=Avg(Sales) & Chr(10) & Sum(Sales) & ' / ' & Count(Sales)
HTH, Change Accordingly as per your need
- Mark as New
- Bookmark
- Subscribe
- Mute
- Subscribe to RSS Feed
- Permalink
- Report Inappropriate Content
Hi Shiva,
Kindly go through the below link which may be helpful for you.
Creating a Good Looking Gauge Chart in Qlikview
Regards,
Dinesh M
- Mark as New
- Bookmark
- Subscribe
- Mute
- Subscribe to RSS Feed
- Permalink
- Report Inappropriate Content
Try the attached: