Unlock a world of possibilities! Login now and discover the exclusive benefits awaiting you.
- Qlik Community
- :
- All Forums
- :
- QlikView App Dev
- :
- Re: Google Maps API
- Subscribe to RSS Feed
- Mark Topic as New
- Mark Topic as Read
- Float this Topic for Current User
- Bookmark
- Subscribe
- Mute
- Printer Friendly Page
- Mark as New
- Bookmark
- Subscribe
- Mute
- Subscribe to RSS Feed
- Permalink
- Report Inappropriate Content
Google Maps API
Hello,
I was looking some QV Dashboards and I found that I can insert a map with some information inside. How can I add this kind of object and associate the places with the information?
If anyone has a demo or some code, please let me know.
That will be great.
Thank you very much.
- « Previous Replies
- Next Replies »
- Mark as New
- Bookmark
- Subscribe
- Mute
- Subscribe to RSS Feed
- Permalink
- Report Inappropriate Content
hi, use the Script.qvs that I attached in the las response. There is the Gmap Key
- Mark as New
- Bookmark
- Subscribe
- Mute
- Subscribe to RSS Feed
- Permalink
- Report Inappropriate Content
I have changed the code in the example for the Dynamic Image and in the expression:
='http://maps.googleapis.com/maps/api/staticmap?center='
&
num(var_mid_lat, '##############', '.', ',' )
&
','
&
num(var_mid_long, '##############', '.', ',' )
&
'&zoom=$(var_zoom)'
&
'&size='&map_size_x&'x'&map_size_y
&
'&maptype='&var_maptype
&
'&sensor=false'
&
'&key='&gmap_key &'
It works very well. Thank you Sokkorn.
- Mark as New
- Bookmark
- Subscribe
- Mute
- Subscribe to RSS Feed
- Permalink
- Report Inappropriate Content
Hi Juan,
Thanks for this work, You helped me a lot.
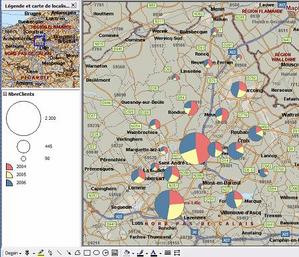
The map implemented is more meaningful by adding a circular dynamic graph reflecting for example the quantities sold by product as the attachment. Is possible?
- Mark as New
- Bookmark
- Subscribe
- Mute
- Subscribe to RSS Feed
- Permalink
- Report Inappropriate Content
plese sen QVS file for this qvw file.
- Mark as New
- Bookmark
- Subscribe
- Mute
- Subscribe to RSS Feed
- Permalink
- Report Inappropriate Content
Hi Juan,
THanks. I think I have somehow gotten the scale wrong. Can you please advise? THe points seem to be squeezed to the centre.
thanks!
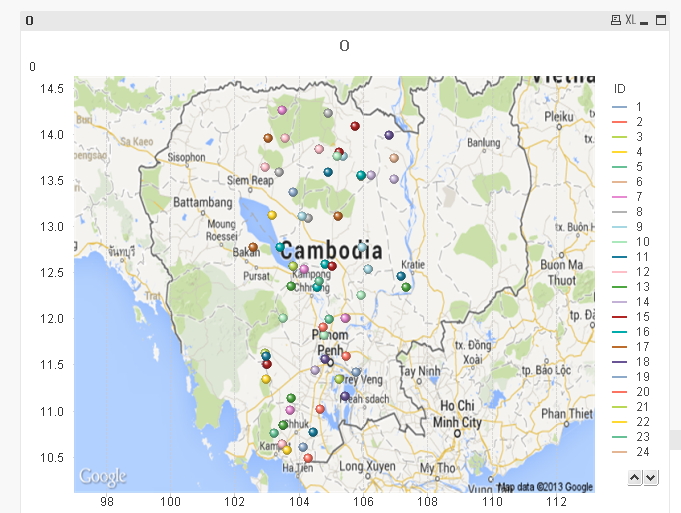
Please advise. Is it the script? or the expressions? thanks!
- Mark as New
- Bookmark
- Subscribe
- Mute
- Subscribe to RSS Feed
- Permalink
- Report Inappropriate Content
Hi Juan,
Up to now this post was very helpful for me.
But the thing here is, now I want to get India map.
For this what should I change in the .xml file.
Thanks in Advance,
Ananth
- Mark as New
- Bookmark
- Subscribe
- Mute
- Subscribe to RSS Feed
- Permalink
- Report Inappropriate Content
Hi Soufiane
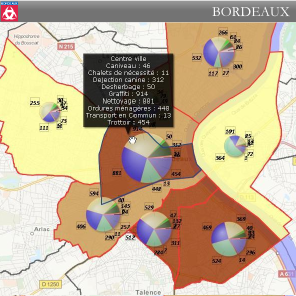
Please could you advise how to change the graph to a circular dynamic graph?
- « Previous Replies
- Next Replies »