Unlock a world of possibilities! Login now and discover the exclusive benefits awaiting you.
- Qlik Community
- :
- All Forums
- :
- QlikView App Dev
- :
- Re: Re: Group By in Qlikview
- Subscribe to RSS Feed
- Mark Topic as New
- Mark Topic as Read
- Float this Topic for Current User
- Bookmark
- Subscribe
- Mute
- Printer Friendly Page
- Mark as New
- Bookmark
- Subscribe
- Mute
- Subscribe to RSS Feed
- Permalink
- Report Inappropriate Content
Group By in Qlikview
Hi All
I have data in the following format
| catalog# | area | Sales | Qty |
| 32B567H | P | $100 | 34 |
| 32B567H | Q | $200 | 12 |
| 32B567H | R | $250 | 56 |
| 32B567H | S | $550 | 21 |
If you calculate the average price for each row, it will look like this
| avg price |
| $ 2.94 |
| $ 16.67 |
| $ 4.46 |
| $ 26.19 |
Now the requirement is to display the Min and Max Average price for each catalog#
| catalog# | Total Sales | Total Qty | Avg Price | max | min |
| 32B567H | $ 1,100 | 123 | $ 8.94 | $ 26.19 | $ 2.94 |
In SQL terms, I have to calculate the Min and Max Average, grouped by Catalog# and Area
How do I achieve this in Qlikview expression? Please advise
- Mark as New
- Bookmark
- Subscribe
- Mute
- Subscribe to RSS Feed
- Permalink
- Report Inappropriate Content
Don't add 'area' field to the straight table.Remove that field and check the values.
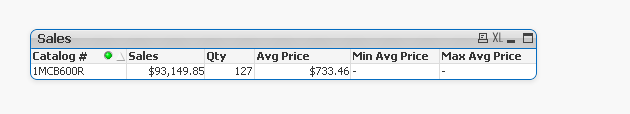
if area field is removed this is what i m getting:
catalog# Total Sales Total Qty Avg Price max min
- Mark as New
- Bookmark
- Subscribe
- Mute
- Subscribe to RSS Feed
- Permalink
- Report Inappropriate Content
Paramita
In qlikview to get the Groupby facility you have to use the pivot table.
No other table will do the groupby.
Use it just like the straight table and select the always expanded option in the presentation tab.
- Mark as New
- Bookmark
- Subscribe
- Mute
- Subscribe to RSS Feed
- Permalink
- Report Inappropriate Content
Karthigayan
You are right, the formula works when I take the data subset for a particular catalog# and hard code it at scripting level.
But for some reason it is giving me wrong results with my entire data set (multiple catalogs). Not sure what is the problem, still debugging.
- Mark as New
- Bookmark
- Subscribe
- Mute
- Subscribe to RSS Feed
- Permalink
- Report Inappropriate Content
have you tried my solution?
- Mark as New
- Bookmark
- Subscribe
- Mute
- Subscribe to RSS Feed
- Permalink
- Report Inappropriate Content
Manish,
I am trying to see if it can be done at expression level instead of any scripting.
Scripting will work I believe.
- Mark as New
- Bookmark
- Subscribe
- Mute
- Subscribe to RSS Feed
- Permalink
- Report Inappropriate Content

Min Sales =
Aggr(min(Sales/Qty),catalog#)
Max Sales =
Aggr(max(Sales/Qty),catalog#)
Thanks and Regards
Padma
- Mark as New
- Bookmark
- Subscribe
- Mute
- Subscribe to RSS Feed
- Permalink
- Report Inappropriate Content
Create a straight table
Dimension
catalog#
Expressions
SUM(Sales)
SUM(Qty)
SUM(Sales)/SUM(Qty)
Max(Aggr(SUM(Sales)/SUM(Qty),area))
Min(Aggr(SUM(Sales)/SUM(Qty),area))
- Mark as New
- Bookmark
- Subscribe
- Mute
- Subscribe to RSS Feed
- Permalink
- Report Inappropriate Content
Thank you all for your helpful suggestions. But as I mentioned for some reason it is not working in my report (Though I checked it works with a small dataset). The 2 columns just dont populate.
(NTA is same as Area. )
I am using -
min(aggr(Sales, [Catalog #],NTA)/aggr(qty, [Catalog #] NTA))
max(aggr(Sales, [Catalog #],NTA)/aggr(qty, [Catalog #], NTA))
Which works perfect in a hardcoded data set.
- Mark as New
- Bookmark
- Subscribe
- Mute
- Subscribe to RSS Feed
- Permalink
- Report Inappropriate Content
Paramita Sahu,
Do you require aggregation to be done on both Catalog# and NTA ???
- Mark as New
- Bookmark
- Subscribe
- Mute
- Subscribe to RSS Feed
- Permalink
- Report Inappropriate Content
Kindly check this out