Unlock a world of possibilities! Login now and discover the exclusive benefits awaiting you.
- Qlik Community
- :
- All Forums
- :
- QlikView App Dev
- :
- Have to show share % in stacked bar chart
- Subscribe to RSS Feed
- Mark Topic as New
- Mark Topic as Read
- Float this Topic for Current User
- Bookmark
- Subscribe
- Mute
- Printer Friendly Page
- Mark as New
- Bookmark
- Subscribe
- Mute
- Subscribe to RSS Feed
- Permalink
- Report Inappropriate Content
Have to show share % in stacked bar chart
Hi All,
When i am trying to show the percentage of brand share in stacked bar chart along with latest 12 months, the share of the brand for the selected period get splits over latest 12 months instead showing individual month share...
Using the below given expression to drive this...
Sum({<IMSAsOfPeriod ={"$(='>=' & Date(AddMonths(Max(IMSAsOfPeriod), -11), 'MMM-YY') & '<=' & Date(Max(IMSAsOfPeriod), 'MMM-YY'))"},IMSFlag={'Current'},IMSAsOfYear, IMSAsOfMonth>}NVALUE)
/
(Sum(total{<IMSAsOfPeriod ={"$(='>=' & Date(AddMonths(Max(IMSAsOfPeriod), -11), 'MMM-YY') & '<=' & Date(Max(IMSAsOfPeriod), 'MMM-YY'))"},IMSFlag={'Current'},IMSAsOfYear, IMSAsOfMonth,BRANDS>}NVALUE))*100
Can anyone help me out of this...
Regards,
Jegadeesan G
- Mark as New
- Bookmark
- Subscribe
- Mute
- Subscribe to RSS Feed
- Permalink
- Report Inappropriate Content
Hi Sunny,
Am getting one issue now in above given solution... The share of the brand value comes wrong when I restricting top 5 brands in stacked bar for selected period...
Regards,
Jegadeesan G
- Mark as New
- Bookmark
- Subscribe
- Mute
- Subscribe to RSS Feed
- Permalink
- Report Inappropriate Content
Would you be able to share a sample to show the issue?
- Mark as New
- Bookmark
- Subscribe
- Mute
- Subscribe to RSS Feed
- Permalink
- Report Inappropriate Content
Hi sunny,
I used below given expression in calculated dimension to show only top 5 brands
=if(aggr(rank(sum({<IMSAsOfYear={'$(=max(IMSAsOfYear))'}>}NVALUE)),BRANDS)<=5,BRANDS)
and used this expression in expression tab
Sum({<IMSAsOfPeriod ={"$(='>=' & Date(AddMonths(Max(IMSAsOfPeriod), -11), 'MMM-YY') & '<=' & Date(Max(IMSAsOfPeriod), 'MMM-YY'))"},IMSFlag={'Current'},IMSAsOfYear, IMSAsOfMonth>}NVALUE)
/
(Sum(TOTAL<IMSAsOfPeriod>{<IMSAsOfPeriod ={"$(='>=' & Date(AddMonths(Max(IMSAsOfPeriod), -11), 'MMM-YY') & '<=' & Date(Max(IMSAsOfPeriod), 'MMM-YY'))"},IMSFlag={'Current'},IMSAsOfYear, IMSAsOfMonth,BRANDS>}NVALUE))
*100
This expression works fine when the brand is below 5 or equal to 5 for the selected period.... I mean, only sold brand for the selected period...
There are some other brand also sold in selected period for example (Jan - 2016)... The brand share totals 100% when i am trying to show only top 5...
- Mark as New
- Bookmark
- Subscribe
- Mute
- Subscribe to RSS Feed
- Permalink
- Report Inappropriate Content
Would you be able to share you app?
Preparing examples for Upload - Reduction and Data Scrambling
- Mark as New
- Bookmark
- Subscribe
- Mute
- Subscribe to RSS Feed
- Permalink
- Report Inappropriate Content
Attached QVW...
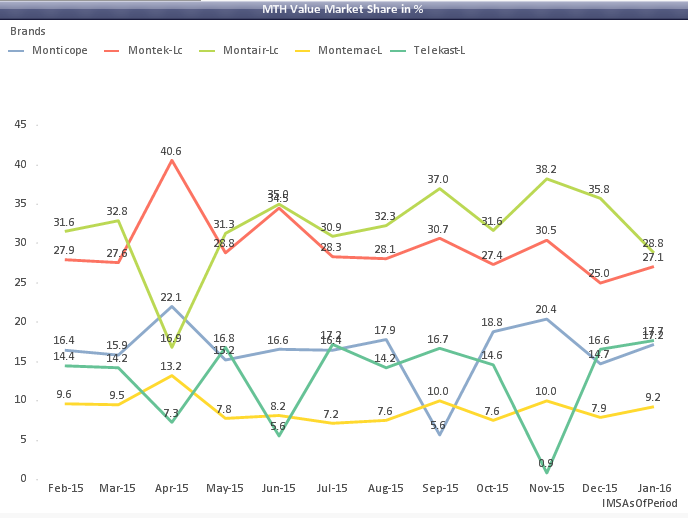
Tab Incremental share and chart MTH Value market share in %
Regards
Jegadeesan G
- Mark as New
- Bookmark
- Subscribe
- Mute
- Subscribe to RSS Feed
- Permalink
- Report Inappropriate Content
There is no data in the application it seems 
- Mark as New
- Bookmark
- Subscribe
- Mute
- Subscribe to RSS Feed
- Permalink
- Report Inappropriate Content
Hi Sunny
data is large. maximum size of attachment is 300mb will shorten the data as soon as possible
- Mark as New
- Bookmark
- Subscribe
- Mute
- Subscribe to RSS Feed
- Permalink
- Report Inappropriate Content
Sounds good... will wait
- Mark as New
- Bookmark
- Subscribe
- Mute
- Subscribe to RSS Feed
- Permalink
- Report Inappropriate Content
Hi Sunny....
Due to large data. I have upload file in google drive
Pls Kindly have a look on it
- Mark as New
- Bookmark
- Subscribe
- Mute
- Subscribe to RSS Feed
- Permalink
- Report Inappropriate Content
You can attach large files here as well? How large is the file? The reason I ask this is because I don't have access to google drive at work and won't be able to look until I am home