Unlock a world of possibilities! Login now and discover the exclusive benefits awaiting you.
- Qlik Community
- :
- All Forums
- :
- QlikView App Dev
- :
- Have to show share % in stacked bar chart
- Subscribe to RSS Feed
- Mark Topic as New
- Mark Topic as Read
- Float this Topic for Current User
- Bookmark
- Subscribe
- Mute
- Printer Friendly Page
- Mark as New
- Bookmark
- Subscribe
- Mute
- Subscribe to RSS Feed
- Permalink
- Report Inappropriate Content
Have to show share % in stacked bar chart
Hi All,
When i am trying to show the percentage of brand share in stacked bar chart along with latest 12 months, the share of the brand for the selected period get splits over latest 12 months instead showing individual month share...
Using the below given expression to drive this...
Sum({<IMSAsOfPeriod ={"$(='>=' & Date(AddMonths(Max(IMSAsOfPeriod), -11), 'MMM-YY') & '<=' & Date(Max(IMSAsOfPeriod), 'MMM-YY'))"},IMSFlag={'Current'},IMSAsOfYear, IMSAsOfMonth>}NVALUE)
/
(Sum(total{<IMSAsOfPeriod ={"$(='>=' & Date(AddMonths(Max(IMSAsOfPeriod), -11), 'MMM-YY') & '<=' & Date(Max(IMSAsOfPeriod), 'MMM-YY'))"},IMSFlag={'Current'},IMSAsOfYear, IMSAsOfMonth,BRANDS>}NVALUE))*100
Can anyone help me out of this...
Regards,
Jegadeesan G
- « Previous Replies
- Next Replies »
- Mark as New
- Bookmark
- Subscribe
- Mute
- Subscribe to RSS Feed
- Permalink
- Report Inappropriate Content
Instead of getting rank in the dimensions. i think rank should be get in the expression itself
(FirstSortedValue({<AsOfMonthNr = {$(=Max({<AsOfYear = {$(=Max(AsOfYear))}>}AsOfMonthNr))},Brand, PeriodType = {'CYMONTH'}, AsOfYear = {"$(='<=' & Max(AsOfYear))"}, AsOfMonth>}
Aggr(Sum({<Brand, PeriodType = {'CYMONTH'}, AsOfYear, AsOfMonth>}Sales), AsOfPeriod, Brand),
-Aggr(Only({<Brand, PeriodType = {'CYMONTH'}, AsOfYear, AsOfMonth>}AsOfPeriod), AsOfPeriod, Brand))
/
Sum(TOTAL<AsOfPeriod> Aggr(FirstSortedValue({<AsOfMonthNr = {$(=Max({<AsOfYear = {$(=Max(AsOfYear))}>}AsOfMonthNr))},Brand, PeriodType = {'CYMONTH'}, AsOfYear = {"$(='<=' & Max(AsOfYear))"}, AsOfMonth>}
Aggr(Sum({<Brand, PeriodType = {'CYMONTH'}, AsOfYear, AsOfMonth>}Sales), AsOfPeriod, Brand, AsOfYear),
-Aggr(Only({<Brand=, PeriodType = {'CYMONTH'}, AsOfYear, AsOfMonth>}AsOfPeriod), AsOfPeriod, Brand, AsOfYear)), AsOfYear, Brand)))
Below expression has to include in above but i dnt know where to apply..
Brand = {"=rank(sum({<AsOfYear={'$(=max(AsOfYear))'}>}Sales)) <= 3"},
- Mark as New
- Bookmark
- Subscribe
- Mute
- Subscribe to RSS Feed
- Permalink
- Report Inappropriate Content
Did you get a chance to open the attached application my friend? I feel like we are doing the same thing as the other post, but you somehow are looking to make it more difficult then it needs to be.... I guess I will let you explore the attached qvw and if you think this is not what you want, then please show me which numbers are not coming in correctly....
Best,
Sunny
- Mark as New
- Bookmark
- Subscribe
- Mute
- Subscribe to RSS Feed
- Permalink
- Report Inappropriate Content
Give me few minutes Sunny... I will get into exact numbers
- Mark as New
- Bookmark
- Subscribe
- Mute
- Subscribe to RSS Feed
- Permalink
- Report Inappropriate Content
Hi Sunny,
I have to calculate MAT for the available data and has to show Top 3 brands for the selected period
Dimensions:- Year, Brand
Expression: (Current Year MAT Sale / Current Total MAT Sale)*100
Note:-
Current Year : latest 12 months i.e.,(Aug-15 to Jul-16)
Expression output value should be plotted in latest year i.e., 2016
Using Below expression I calculated MAT for available data
(FirstSortedValue({<AsOfMonthNr = {$(=Max({<AsOfYear = {$(=Max(AsOfYear))}>}AsOfMonthNr))},Brand, PeriodType = {'CYMONTH'}, AsOfYear = {"$(='<=' & Max(AsOfYear))"}, AsOfMonth>}
Aggr(Sum({<Brand, PeriodType = {'CYMONTH'}, AsOfYear, AsOfMonth>}Sales), AsOfPeriod, Brand),
-Aggr(Only({<Brand, PeriodType = {'CYMONTH'}, AsOfYear, AsOfMonth>}AsOfPeriod), AsOfPeriod, Brand))
/
Sum(TOTAL <AsOfPeriod>Aggr(FirstSortedValue({<AsOfMonthNr = {$(=Max({<AsOfYear = {$(=Max(AsOfYear))}>}AsOfMonthNr))},Brand, PeriodType = {'CYMONTH'}, AsOfYear = {"$(='<=' & Max(AsOfYear))"}, AsOfMonth>}
Aggr(Sum({<Brand, PeriodType = {'CYMONTH'}, AsOfYear, AsOfMonth>}Sales), AsOfPeriod, Brand, AsOfYear),
-Aggr(Only({<Brand=, PeriodType = {'CYMONTH'}, AsOfYear, AsOfMonth>}AsOfPeriod), AsOfPeriod, Brand, AsOfYear)), AsOfYear, Brand)))
Next i need to show Top 3 Brands.
One way i used Dimension Limits option but with this option values are correct but all the showing the legend because each month has different as top 3.Below is the screen for reference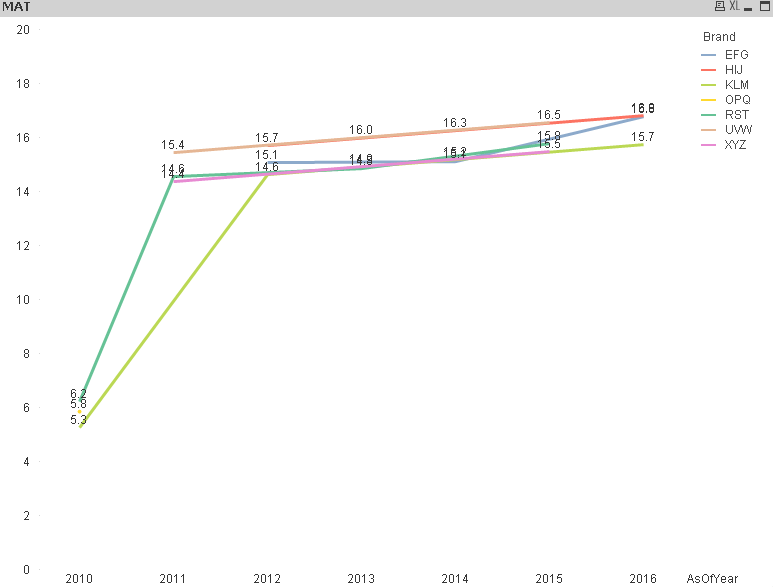
As it is sample data it has only few line in the chart, When I implemented in original too many lines will appear .
So that instead of this option I would like give rank in the expression itself but the output values are wrong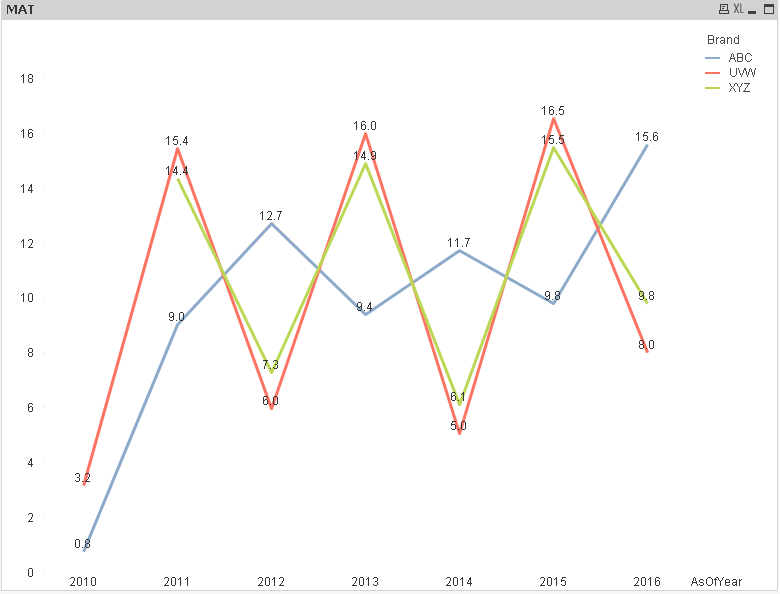
i need to show line chart as Second image with First image values for the selected period
Attached the Sample data
- « Previous Replies
- Next Replies »