Unlock a world of possibilities! Login now and discover the exclusive benefits awaiting you.
- Qlik Community
- :
- All Forums
- :
- QlikView App Dev
- :
- Help - Specific line chart needed
- Subscribe to RSS Feed
- Mark Topic as New
- Mark Topic as Read
- Float this Topic for Current User
- Bookmark
- Subscribe
- Mute
- Printer Friendly Page
- Mark as New
- Bookmark
- Subscribe
- Mute
- Subscribe to RSS Feed
- Permalink
- Report Inappropriate Content
Help - Specific line chart needed
Hi All,
I have a line chart dimensioned by
- Time (Dates formated like 'MMM - YYYY'),
- and a calculated dimension (3 categories based on price evolution)
=If(aggr(avg(Price_Evolution), Part_Code)> dblPriceEvolBorne_Up, 'UP',
If(aggr(avg(Price_Evolution), Part_Code)< dblPriceEvolBorne_Down, 'DOWN', 'STABLE'))
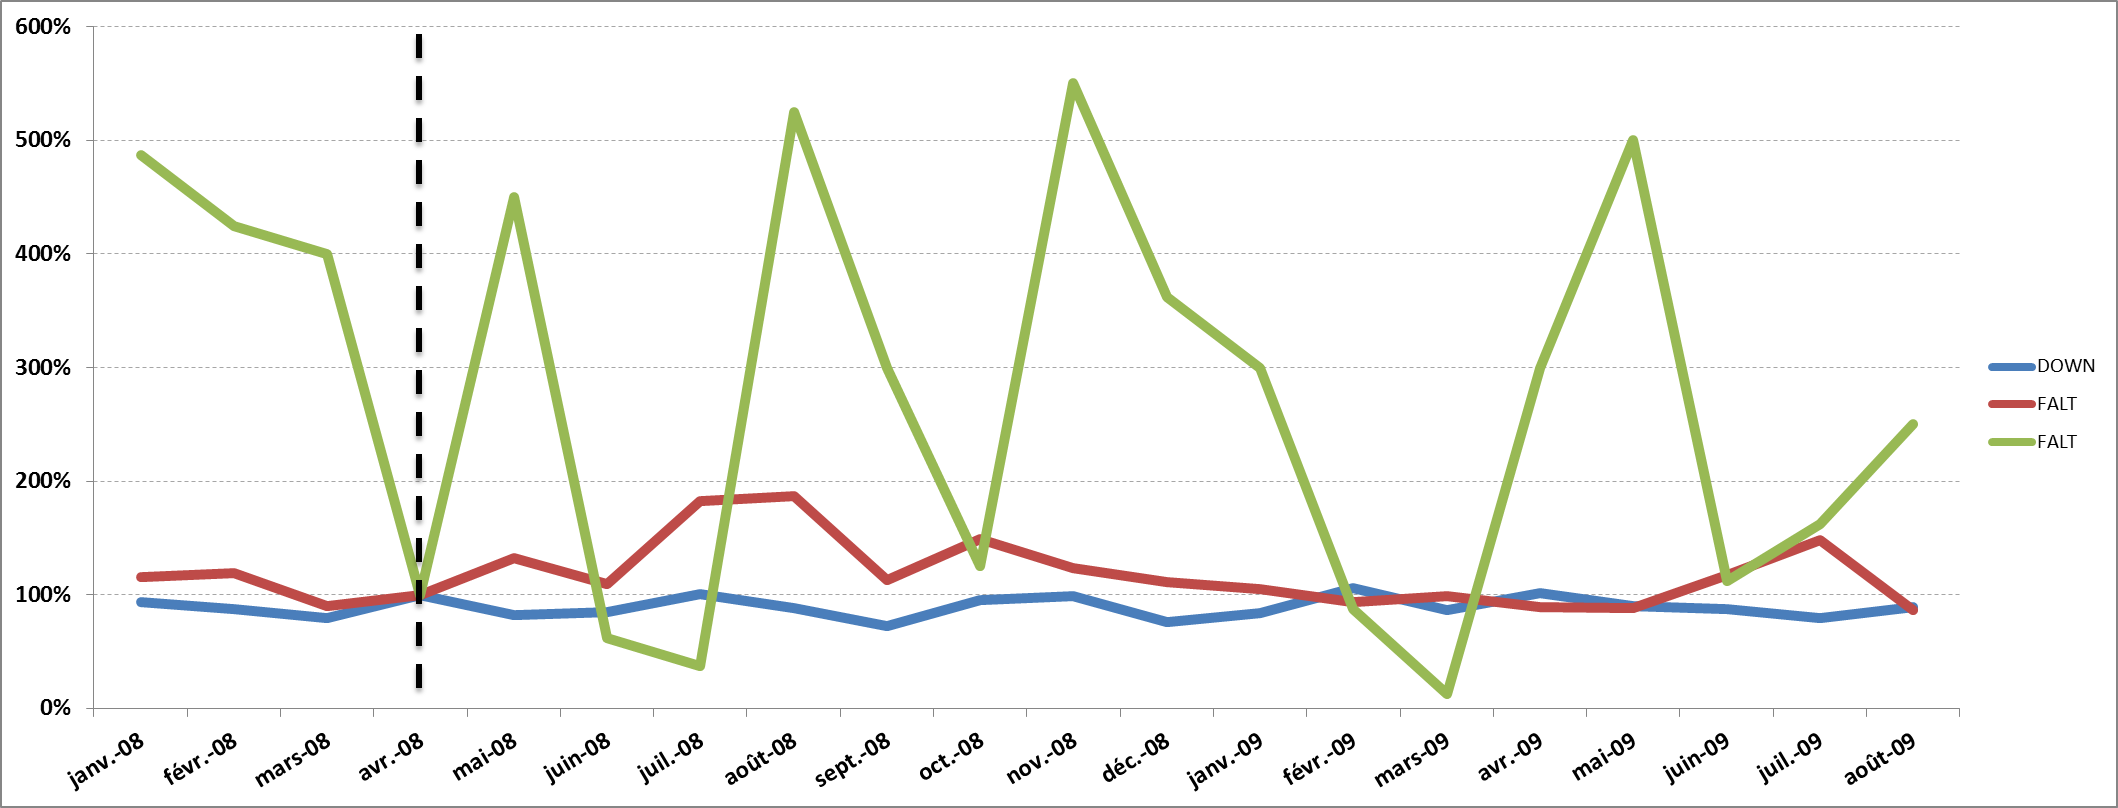
I want to compute a Quantity Index based on a spedific date.
So the chart will display 3 curves (related to the calculated dimension). Each curve will be equal to 100 at the specific date.
The expression I tried is the following :
= Sum(Gross_Quantities) /
Sum({$ <Year_Months={'$(=Min(Implementation_Dates))'}>}
Gross_Quantities)
The issue is that this limit the dimension of the chart to the date specify (only the Min(Implementation_Dates) appears with 3 points).
Please could you help me on this?
Many thanks in advance
- Mark as New
- Bookmark
- Subscribe
- Mute
- Subscribe to RSS Feed
- Permalink
- Report Inappropriate Content
Hi all,
I have no comment on the issue I faced. I post righ now some more elements that could help you understand the issue and what I expect.
You will find join to this message a picture of the chart I expect (made in Excel).
Also there is an qvw file with a sample data that could helpp you understand the issue I face.
Thanks in advance for your help
- Mark as New
- Bookmark
- Subscribe
- Mute
- Subscribe to RSS Feed
- Permalink
- Report Inappropriate Content
Please I need help on it. Is there somebody who could help ?
