Unlock a world of possibilities! Login now and discover the exclusive benefits awaiting you.
- Qlik Community
- :
- All Forums
- :
- QlikView App Dev
- :
- Re: Help please PIVOT / AGGR / SET Analysis
- Subscribe to RSS Feed
- Mark Topic as New
- Mark Topic as Read
- Float this Topic for Current User
- Bookmark
- Subscribe
- Mute
- Printer Friendly Page
- Mark as New
- Bookmark
- Subscribe
- Mute
- Subscribe to RSS Feed
- Permalink
- Report Inappropriate Content
Help please PIVOT / AGGR / SET Analysis
Hi All,
I need a help here. I have a dataset as shown below. The data is coming from 2 diffrent source SYS1 and SYS2. The Column SOURCE tells where the record is coming from. and now i have to render this data in pivot table with extra colum as shown below (diagram2)
I.e what i want is if you see Column Output in diagram 2. It should show the from where the data is come from
Example:
A E I S are presenet in both system so Output is SYS1 and SYS2
B G O U olny in SYS2 So output in SYS2
Would you please paste expression here as im not using license version.
| Source | Col1 | Col2 | Col3 | Col4 |
| Sys1 | A | E | I | S |
| Sys2 | A | E | I | S |
| Sys2 | A | E | M | T |
| Sys1 | A | F | N | U |
| Sys2 | B | G | O | P |
| Sys1 | C | H | P | W |
| Sys2 | C | H | P | W |
| Sys1 | C | H | P | X |
| Sys2 | C | H | P | X |
| Sys2 | D | I | Q | Y |
| Sys1 | D | J | R | Z |
| Sys1 | D | K | R | AA |
| Sys2 | D | K | R | AA |
| Level1 | Level2 | Lev2l3 | Level4 | Output |
| A | E | l | S | Sys1, Sys2 |
| M | T | Sys1 | ||
| F | N | U | Sys2 | |
| B | G | O | V | Sys1 |
| C | H | P | W | Sys1,Sys2 |
| C | X | Sys1,Sys2 | ||
| D | I | Q | Y | Sys2 |
| D | J | R | Z | Sys1 |
| D | K | AA | Sys1,Sys2 |
- Mark as New
- Bookmark
- Subscribe
- Mute
- Subscribe to RSS Feed
- Permalink
- Report Inappropriate Content
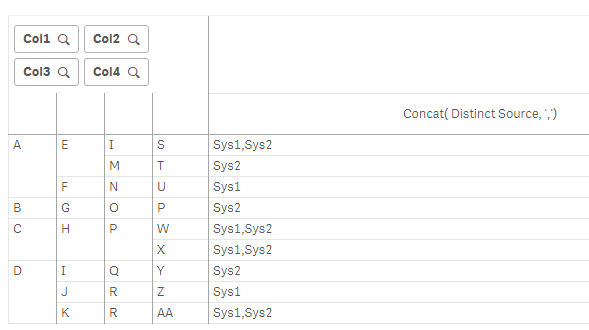
try like below
exp:
Concat( Distinct Source, ',')
- Mark as New
- Bookmark
- Subscribe
- Mute
- Subscribe to RSS Feed
- Permalink
- Report Inappropriate Content
Hello!
Create pivot table with four dimensions and one expression with concat() function.
Smth like that:
=Concat(distinct Source, ',')
- Mark as New
- Bookmark
- Subscribe
- Mute
- Subscribe to RSS Feed
- Permalink
- Report Inappropriate Content
Thanks Sergey. Ya it helped.
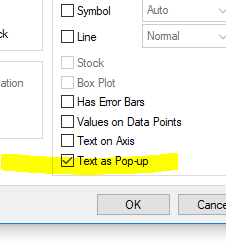
If i want to show the output value in Mouse hover in Col4
- Mark as New
- Bookmark
- Subscribe
- Mute
- Subscribe to RSS Feed
- Permalink
- Report Inappropriate Content
- Mark as New
- Bookmark
- Subscribe
- Mute
- Subscribe to RSS Feed
- Permalink
- Report Inappropriate Content
Col4? Where you have S, T, U values?
If so, you can use calculated dimension Col4:
=Col4
&chr(10)&
aggr(
Concat(distinct Source, ',')
,Col1
,Col2
,Col3
)