Unlock a world of possibilities! Login now and discover the exclusive benefits awaiting you.
- Qlik Community
- :
- All Forums
- :
- QlikView App Dev
- :
- Hirarchy in one column
- Subscribe to RSS Feed
- Mark Topic as New
- Mark Topic as Read
- Float this Topic for Current User
- Bookmark
- Subscribe
- Mute
- Printer Friendly Page
- Mark as New
- Bookmark
- Subscribe
- Mute
- Subscribe to RSS Feed
- Permalink
- Report Inappropriate Content
Hirarchy in one column
Hi All,
do you any way to present hierarchical data in one column? It cannot be a treeview and has to be dynamic i.e. if there is another dim e.g. D it will appear in the first set after C.
| Dim | Value |
| A | 2 |
| B | 4 |
| C | 6 |
| Total (A+B+C) | 12 |
| G | -3 |
| H | -5 |
| Total (A+B+C+G+H) | 4 |
| I | 7 |
| Total (A+B+C+G+G+H+I) | 11 |
Regards,
Przemek
- Mark as New
- Bookmark
- Subscribe
- Mute
- Subscribe to RSS Feed
- Permalink
- Report Inappropriate Content
Any idea?
- Mark as New
- Bookmark
- Subscribe
- Mute
- Subscribe to RSS Feed
- Permalink
- Report Inappropriate Content
Hi ,
Do you wanted to have this Table Data in Script Table or Chart Straight Table?
//Yusuf
- Mark as New
- Bookmark
- Subscribe
- Mute
- Subscribe to RSS Feed
- Permalink
- Report Inappropriate Content
Hi yusuf,
chart. I need to present profit & loss report without adding extra columns in the chart - have the structure in one column only.
Regards,
Przemek
- Mark as New
- Bookmark
- Subscribe
- Mute
- Subscribe to RSS Feed
- Permalink
- Report Inappropriate Content
Hi,
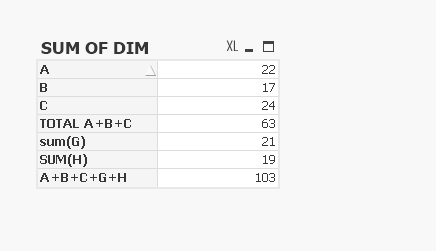
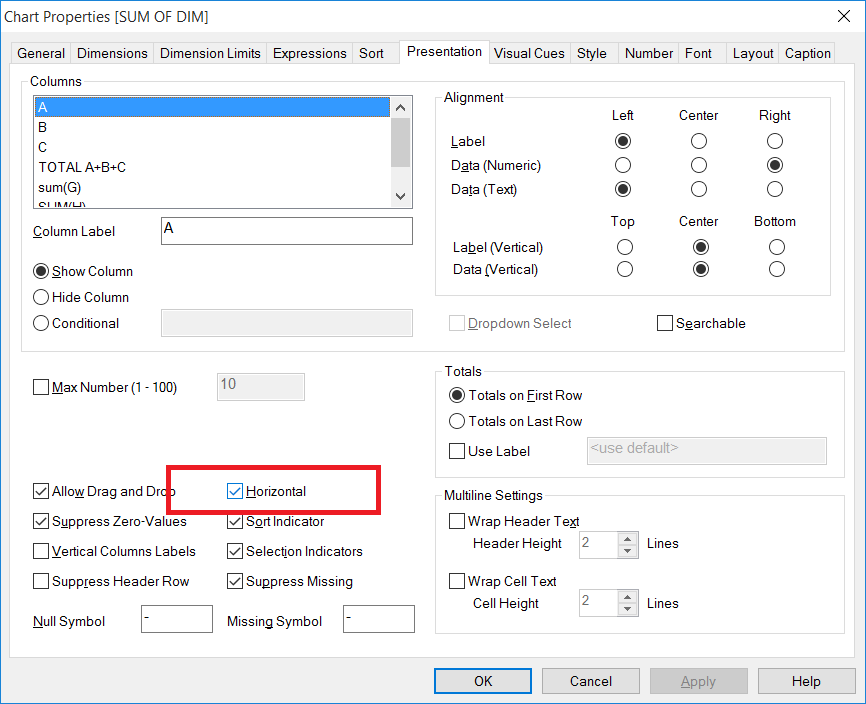
Hopefully the attached would give you some insight on how to work with your data.
The attached has been made assuming each of the calculations are separate dimensions.


If a post helps to resolve your issue, please accept it as a Solution.
- Mark as New
- Bookmark
- Subscribe
- Mute
- Subscribe to RSS Feed
- Permalink
- Report Inappropriate Content
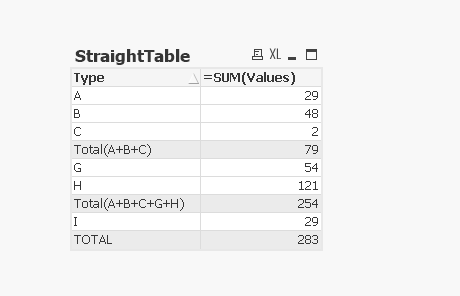
Here is another solution if all your Attributes A,B,G,H etc are in a single column

LOAD Type,
Values
FROM
(txt, codepage is 1252, embedded labels, delimiter is '\t', msq);
CONCATENATE
LOAD
'Total(A+B+C)' as Type,
sum(Values) as Values
FROM
(txt, codepage is 1252, embedded labels, delimiter is '\t', msq)
WHERE wildmatch(Type,'A','B','C')>0;
CONCATENATE
LOAD
'Total(A+B+C+G+H)' as Type,
sum(Values) as Values
FROM
(txt, codepage is 1252, embedded labels, delimiter is '\t', msq)
WHERE wildmatch(Type,'I')=0;
CONCATENATE
LOAD
'TOTAL' as Type,
sum(Values) as Values
FROM
(txt, codepage is 1252, embedded labels, delimiter is '\t', msq);
TypeSortOrder:
LOAD * Inline [
Type,SortOrder
A,1
B,2
C,3
Total(A+B+C),4
G,5
H,6
Total(A+B+C+G+H),7
I,8
TOTAL,9
];
If a post helps to resolve your issue, please accept it as a Solution.