Unlock a world of possibilities! Login now and discover the exclusive benefits awaiting you.
- Qlik Community
- :
- All Forums
- :
- QlikView App Dev
- :
- Histogram with value intervals as dimension.
- Subscribe to RSS Feed
- Mark Topic as New
- Mark Topic as Read
- Float this Topic for Current User
- Bookmark
- Subscribe
- Mute
- Printer Friendly Page
- Mark as New
- Bookmark
- Subscribe
- Mute
- Subscribe to RSS Feed
- Permalink
- Report Inappropriate Content
Histogram with value intervals as dimension.
Hello,
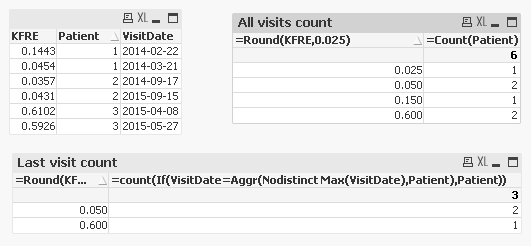
I have the following fact table:
VisitDate, Patient, KFRE
KFRE is a numerical value between 0 and1.
I was able to create a nice simple histogram where chart dimension is =Round(KFRE, 0.025) and expression is =Count(Patient) .
This gives me the number of visits with KFRE values within each KFRE interval for all the visits.
Since a patient can have more than 1 visit I need such histogram but only for the last patient's visit.
The expression would be something like this:
=Count({<VisitDate={$(=Max(VisitDate))}>}Patient)
but I am not getting any values on output.
What am I doing wrong?
- « Previous Replies
-
- 1
- 2
- Next Replies »
- Mark as New
- Bookmark
- Subscribe
- Mute
- Subscribe to RSS Feed
- Permalink
- Report Inappropriate Content
I have found a solution in this thread:Help with Set Analysis - MAX
The needed expression does not use set analysis:
=count(If(VisitDate=Aggr(Nodistinct Max(VisitDate),Patient),Patient))

- Mark as New
- Bookmark
- Subscribe
- Mute
- Subscribe to RSS Feed
- Permalink
- Report Inappropriate Content
Thanks for sharing.... I am sure others will benefit from this
- « Previous Replies
-
- 1
- 2
- Next Replies »