Unlock a world of possibilities! Login now and discover the exclusive benefits awaiting you.
- Qlik Community
- :
- All Forums
- :
- QlikView
- :
- How can i preserve the column headers in a pivot t...
- Subscribe to RSS Feed
- Mark Topic as New
- Mark Topic as Read
- Float this Topic for Current User
- Bookmark
- Subscribe
- Mute
- Printer Friendly Page
- Mark as New
- Bookmark
- Subscribe
- Mute
- Subscribe to RSS Feed
- Permalink
- Report Inappropriate Content
How can i preserve the column headers in a pivot table when there is no data to display?
I have a pivot table with 8 columns. Certain filters in my dashboard prevent any data from displaying in the pivot table, which is fine because it is designed to only show changes from the previous week. The problem is that when there is no data, the column headers for my expressions disappear and I am left with only 2 column headers. How can I keep all column headers displaying even when there is no data in the pivot table? I have checked Always fully expanded.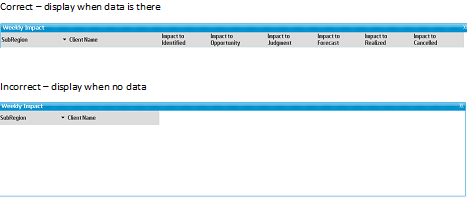
- Mark as New
- Bookmark
- Subscribe
- Mute
- Subscribe to RSS Feed
- Permalink
- Report Inappropriate Content
Hey there,
Have you tried unchecking 'Suppress zero' and 'Suppress missing' options in Presentation tab?
- Mark as New
- Bookmark
- Subscribe
- Mute
- Subscribe to RSS Feed
- Permalink
- Report Inappropriate Content
Hi,
Uncheck Suppress zero values and and select Populate Missing Cells option in
Chart Properties -> Presentation tab.
Hope this helps you.
Regards,
Jagan.
- Mark as New
- Bookmark
- Subscribe
- Mute
- Subscribe to RSS Feed
- Permalink
- Report Inappropriate Content
The expression columns only show changes from the prior week to the current week. The problem with this solutions is that it shows all rows with null values and I don't want to do that, I only want to show those values that have changed, excluding all rows that do not have changes. Is there a way to maybe just show one row of all "-" instead to indicate no data changes and preserve the column headers?
- Mark as New
- Bookmark
- Subscribe
- Mute
- Subscribe to RSS Feed
- Permalink
- Report Inappropriate Content
I have the same question.
My data is;
Process,
[Control ID],
Timing,
Auditor,
Status,
[Control Description]
Status may be ; Finished, In Progress, and Not Initiated
As I update the source data, and don't have any 'Not Initiated', how does Qlik know to keep that header?
Here is my data;
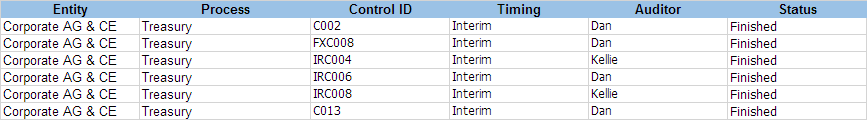
I want to keep a header that says "In Progress'.