Unlock a world of possibilities! Login now and discover the exclusive benefits awaiting you.
- Qlik Community
- :
- All Forums
- :
- QlikView App Dev
- :
- How do I turn my electricity usage data into a dai...
- Subscribe to RSS Feed
- Mark Topic as New
- Mark Topic as Read
- Float this Topic for Current User
- Bookmark
- Subscribe
- Mute
- Printer Friendly Page
- Mark as New
- Bookmark
- Subscribe
- Mute
- Subscribe to RSS Feed
- Permalink
- Report Inappropriate Content
How do I turn my electricity usage data into a daily graph?
Hello QC,
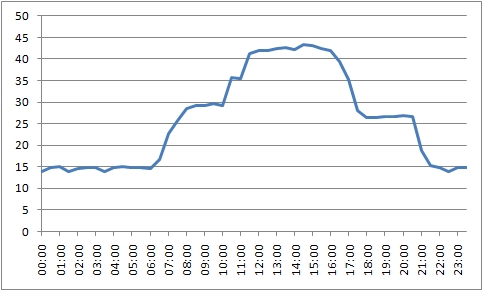
This is my first post so I hope I can get my problem across accurately. My company has a commitment to show it's environmental impact and one of these includes graphically showing our daily electricity usage. I have attached the spreadsheet which I download monthly from our electricity supplier (Scottish Power). On the first tab is the type of graph I would like display in Qlikview, you can see how I have selected the row of 1/2 hourly values for a given day and plotted the values (I have used the column headers as the axis text)

In Qlikview I would like to be able to have a selection box showing the dates available and when a date is selected the daily usage is shown.
Is this possible, or has Qlikview met it's match with this spreadsheet layout?
Thanks
John
Accepted Solutions
- Mark as New
- Bookmark
- Subscribe
- Mute
- Subscribe to RSS Feed
- Permalink
- Report Inappropriate Content
Think that you may normalize the data with the Crosstable-function, and then make your graph.
See the attached example
HTH
Peter
- Mark as New
- Bookmark
- Subscribe
- Mute
- Subscribe to RSS Feed
- Permalink
- Report Inappropriate Content
Hello john,
you can start by using your date field as a list box and then create a Line Chart with the Date time field as a Dimension and sum(Usage) as expression.
Thanks,
ANDY
- Mark as New
- Bookmark
- Subscribe
- Mute
- Subscribe to RSS Feed
- Permalink
- Report Inappropriate Content
Think that you may normalize the data with the Crosstable-function, and then make your graph.
See the attached example
HTH
Peter
- Mark as New
- Bookmark
- Subscribe
- Mute
- Subscribe to RSS Feed
- Permalink
- Report Inappropriate Content
hi,
I hope I've saved your companty some Kwh
- Mark as New
- Bookmark
- Subscribe
- Mute
- Subscribe to RSS Feed
- Permalink
- Report Inappropriate Content
Thanks Prieper & Pat.agen, both of your solutions were brilliant. Peter your very concise cross table of

is great.
Thanks
John