Unlock a world of possibilities! Login now and discover the exclusive benefits awaiting you.
- Qlik Community
- :
- All Forums
- :
- QlikView App Dev
- :
- How to Avoid disappearing the bars in Bar chart wh...
- Subscribe to RSS Feed
- Mark Topic as New
- Mark Topic as Read
- Float this Topic for Current User
- Bookmark
- Subscribe
- Mute
- Printer Friendly Page
- Mark as New
- Bookmark
- Subscribe
- Mute
- Subscribe to RSS Feed
- Permalink
- Report Inappropriate Content
How to Avoid disappearing the bars in Bar chart when one of the Bar is selected?
Hello Techies,
They way qlikview works is when select/click on the bar of the bar chart, bar chart would only display the selected bar and all other bars would disappear. Is there an way that we can avoid that? Is there any way that we can still show the other bars (may be not highlighted)?
Thanks,
Venu
- Mark as New
- Bookmark
- Subscribe
- Mute
- Subscribe to RSS Feed
- Permalink
- Report Inappropriate Content
You can def. do that.
Check out the attached where selected country remains green and the other bar turns blue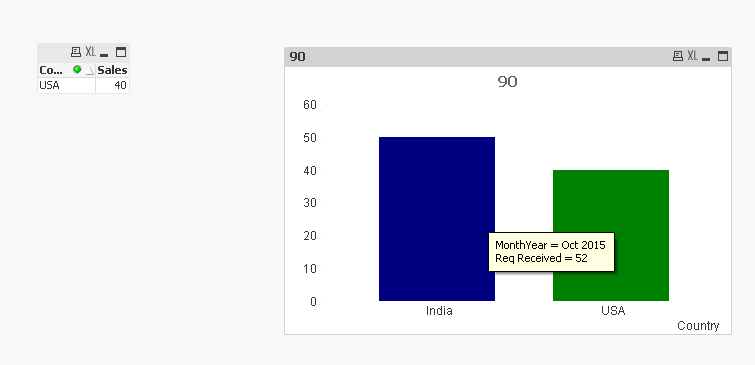
- Mark as New
- Bookmark
- Subscribe
- Mute
- Subscribe to RSS Feed
- Permalink
- Report Inappropriate Content
Sunny.
If we can do that, Is there a way? I have 3 bar charts which are in hierarchy. If I select one It will filter out the respective ones in other bar charts, we don't want other bars to be disappeared in all other respective charts.
Could you please provide the steps, if you have?
Thanks,
Venu
- Mark as New
- Bookmark
- Subscribe
- Mute
- Subscribe to RSS Feed
- Permalink
- Report Inappropriate Content
Not sure I understand. Would you be able to draw me a picture here
- Mark as New
- Bookmark
- Subscribe
- Mute
- Subscribe to RSS Feed
- Permalink
- Report Inappropriate Content
Hi Venu,
There are couple possible solutions:
1. Use Alternate state for every chart
2. Create additional fields Country1, Country2, Country3 etc.
Please review attached
- Mark as New
- Bookmark
- Subscribe
- Mute
- Subscribe to RSS Feed
- Permalink
- Report Inappropriate Content
Sorry all for the delayed response and thanks for your reply. I will post a detailed scenario with all the details.
Thanks,
Venu
- Mark as New
- Bookmark
- Subscribe
- Mute
- Subscribe to RSS Feed
- Permalink
- Report Inappropriate Content
Hi Sunny,
Thanks for your reply. I am posting a detailed scenario with all the details.
I have 3 dimensions and a measure.
1. Category
2, Sub Category
3. Product Name
4. Sales (Measure)
I am trying to display the charts using the above dimensions and measures as shown below.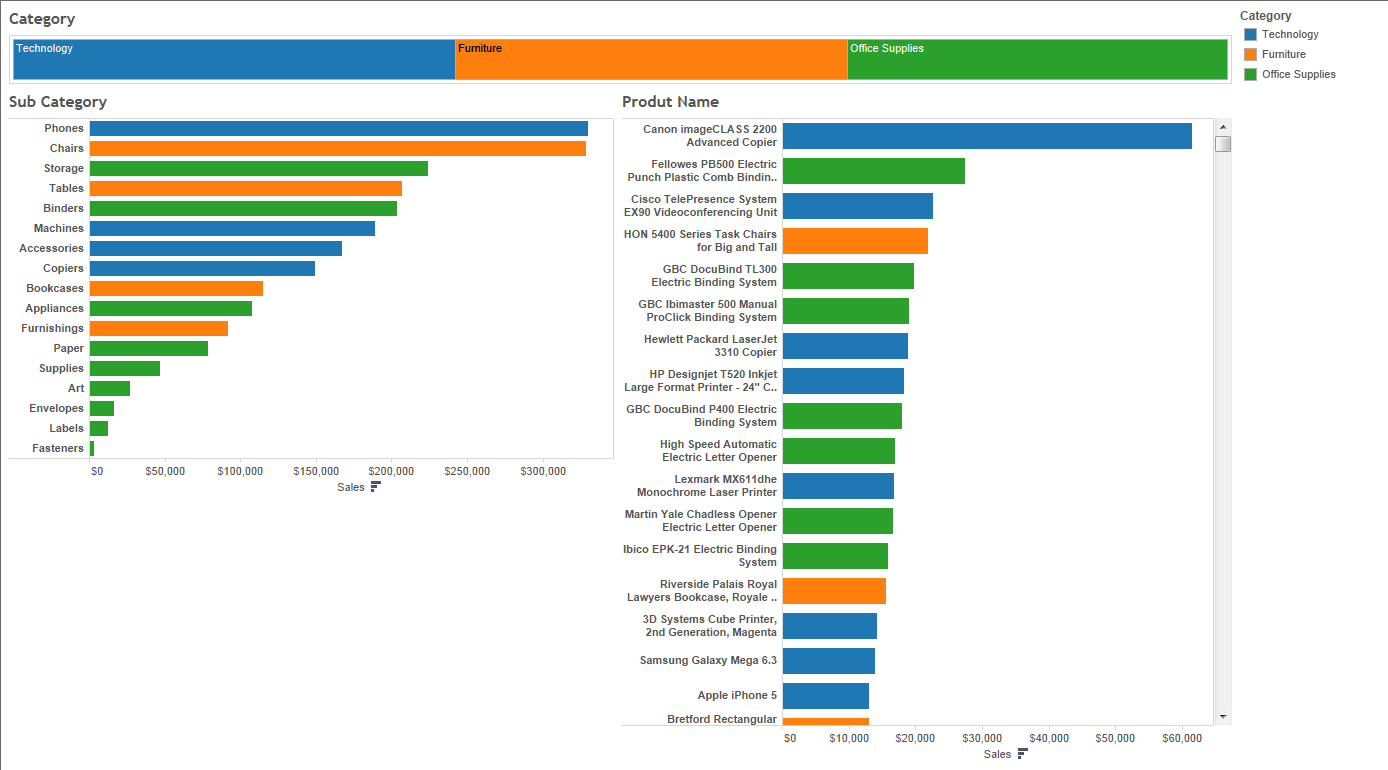
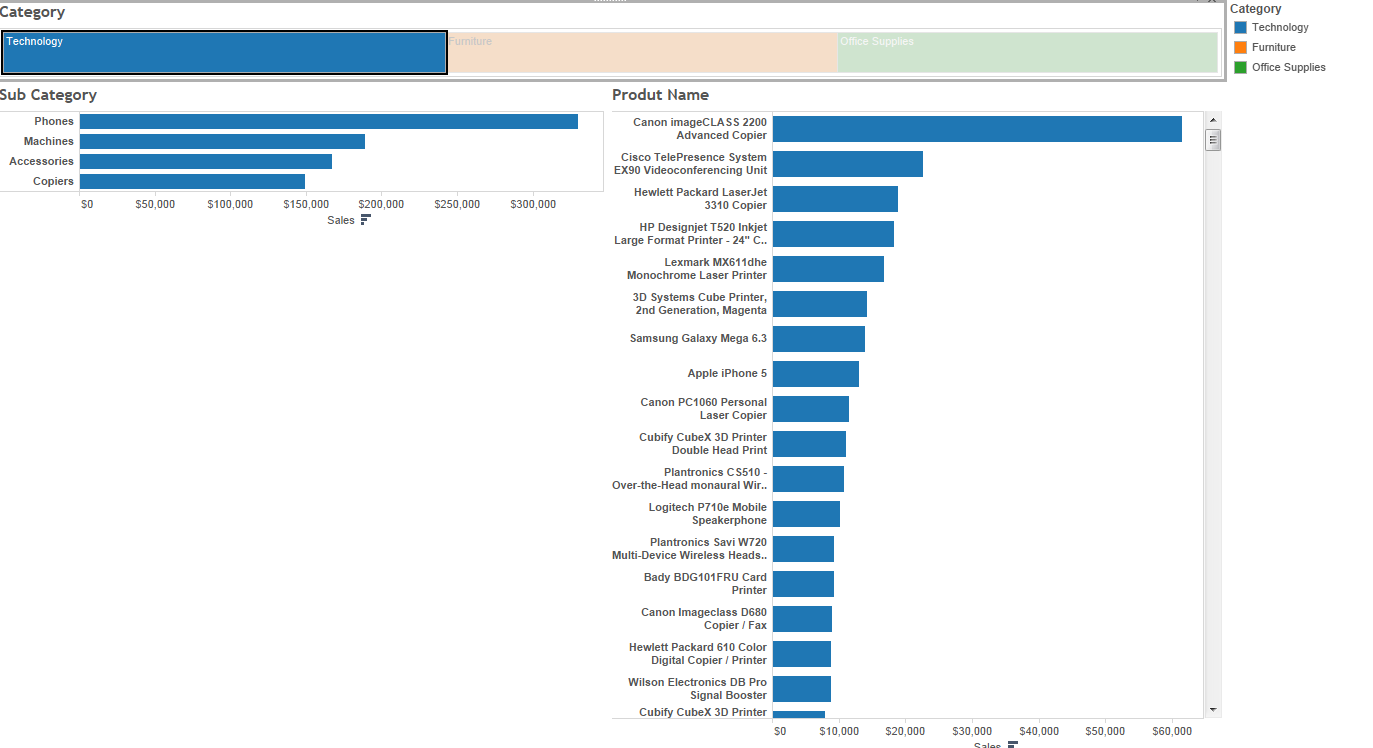
Above all 3 charts are colored by Category. If I select Technology under category chart other two bar charts should display the respective values and color as shown below and most importantly the Category chart should not filter out other two categories when Technology is selected and display the Furniture and Office supplies categories with the true colors (though grayed out) as shown below.
I am also attaching the sample data file as well.
Any help would be highly appreciated.
Thanks,
Venu