Unlock a world of possibilities! Login now and discover the exclusive benefits awaiting you.
- Qlik Community
- :
- All Forums
- :
- QlikView App Dev
- :
- Re: How to add Aggregate data
- Subscribe to RSS Feed
- Mark Topic as New
- Mark Topic as Read
- Float this Topic for Current User
- Bookmark
- Subscribe
- Mute
- Printer Friendly Page
- Mark as New
- Bookmark
- Subscribe
- Mute
- Subscribe to RSS Feed
- Permalink
- Report Inappropriate Content
How to add Aggregate data
hi,
I want to use aggregate row to distinct data in straight,just like bellow:
.jpg)
But i found the straight table's aggregate can't do this,it can't use expression to distinct repeating data。Column1 is a dimension,used and subtotal is expression.So i want to add a aggregate row at the bottom by using expression to distinct repeating data.
Am i right ? and Who can help me?
Thks
- Tags:
- qlikview_scripting
- Mark as New
- Bookmark
- Subscribe
- Mute
- Subscribe to RSS Feed
- Permalink
- Report Inappropriate Content
hi,
Thank you!
If i add an expression ,iCan it be at the buttom ? Because i have other several expressions
- Mark as New
- Bookmark
- Subscribe
- Mute
- Subscribe to RSS Feed
- Permalink
- Report Inappropriate Content
Hi
either you add an expression in graph to have total,
either you put it under graph in a text box : count(total distinct used)
- Mark as New
- Bookmark
- Subscribe
- Mute
- Subscribe to RSS Feed
- Permalink
- Report Inappropriate Content
Hi,
Thank you.
Can use rowno() to add a new row to get aggergae total at the bottom ?How to do this ?
I have a another question:
I have a user-defined format like -6ppt(s),can it be as
a negative number and be marked red automatic ?
- Mark as New
- Bookmark
- Subscribe
- Mute
- Subscribe to RSS Feed
- Permalink
- Report Inappropriate Content
no rowno() is not for that
if you don't want another expression use a text box with definition is : = count(total distinct used)
- Mark as New
- Bookmark
- Subscribe
- Mute
- Subscribe to RSS Feed
- Permalink
- Report Inappropriate Content
for color :
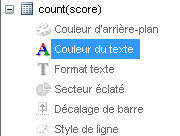
and in definition :
if(your expression <0,red())
- Mark as New
- Bookmark
- Subscribe
- Mute
- Subscribe to RSS Feed
- Permalink
- Report Inappropriate Content
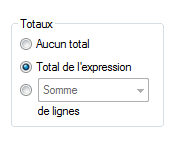
in the screen "expression", here is to add general total of expression :
- Mark as New
- Bookmark
- Subscribe
- Mute
- Subscribe to RSS Feed
- Permalink
- Report Inappropriate Content
HI,
Thank you.
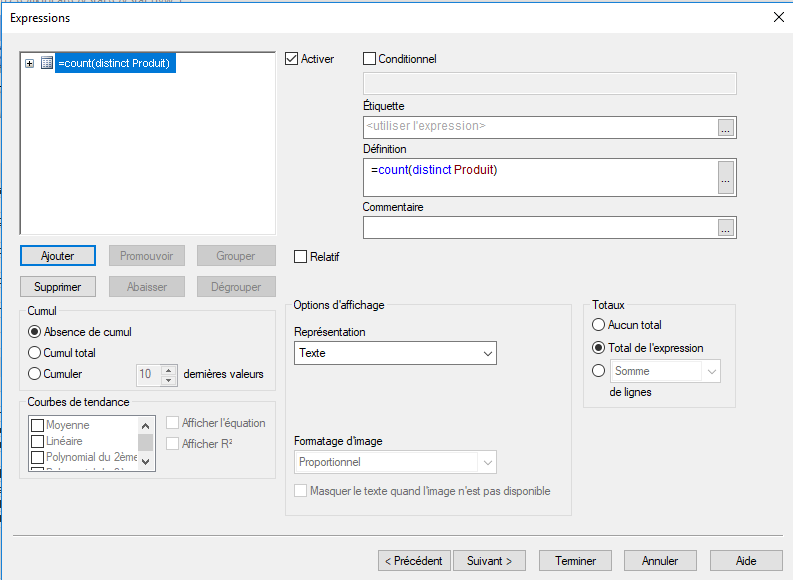
Can the general total of expression in the screen "expression" be add this definition : count(total distinct used) ?
and if can,Where to add?
- Mark as New
- Bookmark
- Subscribe
- Mute
- Subscribe to RSS Feed
- Permalink
- Report Inappropriate Content
hi, just like this :
- Mark as New
- Bookmark
- Subscribe
- Mute
- Subscribe to RSS Feed
- Permalink
- Report Inappropriate Content
hi,
Thank you.
It will be at the bottom?
i have several expressions ,so it can't be at the right .
- Mark as New
- Bookmark
- Subscribe
- Mute
- Subscribe to RSS Feed
- Permalink
- Report Inappropriate Content
hi,
Are you here?