Unlock a world of possibilities! Login now and discover the exclusive benefits awaiting you.
- Qlik Community
- :
- All Forums
- :
- QlikView App Dev
- :
- Re: How to add calculated fields to a chart
- Subscribe to RSS Feed
- Mark Topic as New
- Mark Topic as Read
- Float this Topic for Current User
- Bookmark
- Subscribe
- Mute
- Printer Friendly Page
- Mark as New
- Bookmark
- Subscribe
- Mute
- Subscribe to RSS Feed
- Permalink
- Report Inappropriate Content
How to add calculated fields to a chart
Hi. It's my second day in qlik  I'm trying to lear how to develop small reports in it.
My questions is the following:
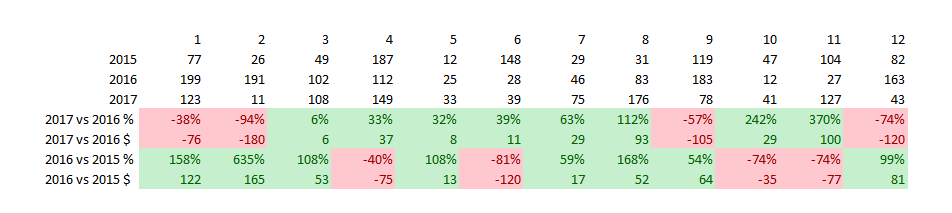
How could I create something like this:
I have managed to do the first part: to get the data
But now i would like to do this calculation inside the chart.
Is this possible?
Accepted Solutions
- Mark as New
- Bookmark
- Subscribe
- Mute
- Subscribe to RSS Feed
- Permalink
- Report Inappropriate Content
Hi Ionut,
It looks like you need a pivot table with one dimension (month number is it?) and seven expressions.
Use these expressions:
2015: Sum({$<Year = {2015}>}Amount)
2016: Sum({$<Year = {2016}>}Amount)
2017: Sum({$<Year = {2017}>}Amount)
2017 vs 2016 % : (Sum({$<Year = {2017}>}Amount) - Sum({$<Year = {2016}>}Amount))/Sum({$<Year = {2016}>}Amount)
2017 vs 2016 : Sum({$<Year = {2017}>}Amount) - Sum({$<Year = {2016}>}Amount)
2016 vs 2015 % : (Sum({$<Year = {2016}>}Amount) - Sum({$<Year = {2015}>}Amount))/Sum({$<Year = {2015}>}Amount)
2016 vs 2015 : Sum({$<Year = {2016}>}Amount) - Sum({$<Year = {2015}>}Amount)
Drag the elements of the pivot table around so you get the month number dimension horizontal and the expressions a seven rows.
Good luck
Andrew
- Mark as New
- Bookmark
- Subscribe
- Mute
- Subscribe to RSS Feed
- Permalink
- Report Inappropriate Content
Hi Ionut, welcome!
Yes, It's possible.
If i correctly understood you need follow this steps:
1 - Drag a table to your chart
2- Select Dimension 1 (2016, i believe)
3 - Select Dimension 2 (2017)
4- Left Click on Dimension, but now click FX, that will open a editor expression, you can put all your expression.
Obs:
Instead step 4, you can add a measure, to get other options like SUM,MAX,MIN etc.
- Mark as New
- Bookmark
- Subscribe
- Mute
- Subscribe to RSS Feed
- Permalink
- Report Inappropriate Content
Glad you were on right platform
So, here consider it as all expressions in straight then enable horizontal option in presentation tab.. for percentage you need relative or should be in option enabled from number tab..
- Mark as New
- Bookmark
- Subscribe
- Mute
- Subscribe to RSS Feed
- Permalink
- Report Inappropriate Content
My Data comes from a table like this

This means that YEAR is a dimension - not the year value
So - I'm stuck here 
Also - do you know of a document that shows how write expressions?
- Mark as New
- Bookmark
- Subscribe
- Mute
- Subscribe to RSS Feed
- Permalink
- Report Inappropriate Content
Hi Ionut,
It looks like you need a pivot table with one dimension (month number is it?) and seven expressions.
Use these expressions:
2015: Sum({$<Year = {2015}>}Amount)
2016: Sum({$<Year = {2016}>}Amount)
2017: Sum({$<Year = {2017}>}Amount)
2017 vs 2016 % : (Sum({$<Year = {2017}>}Amount) - Sum({$<Year = {2016}>}Amount))/Sum({$<Year = {2016}>}Amount)
2017 vs 2016 : Sum({$<Year = {2017}>}Amount) - Sum({$<Year = {2016}>}Amount)
2016 vs 2015 % : (Sum({$<Year = {2016}>}Amount) - Sum({$<Year = {2015}>}Amount))/Sum({$<Year = {2015}>}Amount)
2016 vs 2015 : Sum({$<Year = {2016}>}Amount) - Sum({$<Year = {2015}>}Amount)
Drag the elements of the pivot table around so you get the month number dimension horizontal and the expressions a seven rows.
Good luck
Andrew
- Mark as New
- Bookmark
- Subscribe
- Mute
- Subscribe to RSS Feed
- Permalink
- Report Inappropriate Content
Cool, it worked! Thanks
- Mark as New
- Bookmark
- Subscribe
- Mute
- Subscribe to RSS Feed
- Permalink
- Report Inappropriate Content
Yuhhu
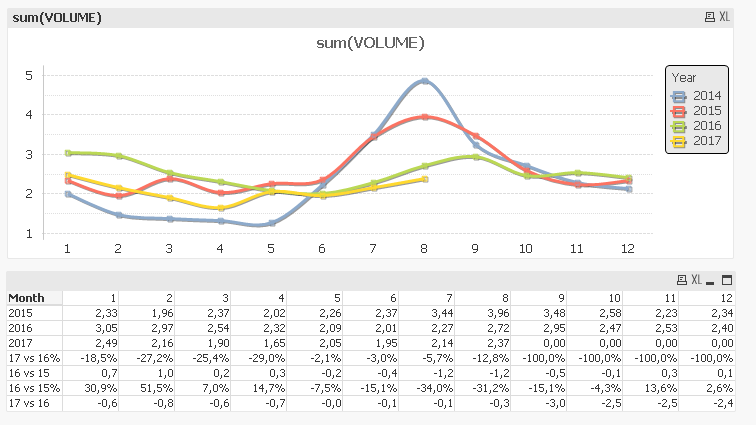
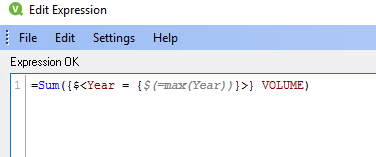
I managed to do it dynamic
- Mark as New
- Bookmark
- Subscribe
- Mute
- Subscribe to RSS Feed
- Permalink
- Report Inappropriate Content
Hi Ionut,
Nice - I originally started writing my suggestion with dynamic years but hardcoded instead because I thought it best to address only the question you posed and not add any complications. 
- Mark as New
- Bookmark
- Subscribe
- Mute
- Subscribe to RSS Feed
- Permalink
- Report Inappropriate Content
Hi Ionut,
Sorry my delay, i saw that you solve your problem.
But anyway get this documento about set analisys
- Mark as New
- Bookmark
- Subscribe
- Mute
- Subscribe to RSS Feed
- Permalink
- Report Inappropriate Content
Really cool, thanks!!