Unlock a world of possibilities! Login now and discover the exclusive benefits awaiting you.
- Qlik Community
- :
- All Forums
- :
- QlikView App Dev
- :
- How to add count to the x-axis label?
- Subscribe to RSS Feed
- Mark Topic as New
- Mark Topic as Read
- Float this Topic for Current User
- Bookmark
- Subscribe
- Mute
- Printer Friendly Page
- Mark as New
- Bookmark
- Subscribe
- Mute
- Subscribe to RSS Feed
- Permalink
- Report Inappropriate Content
How to add count to the x-axis label?
Hi,
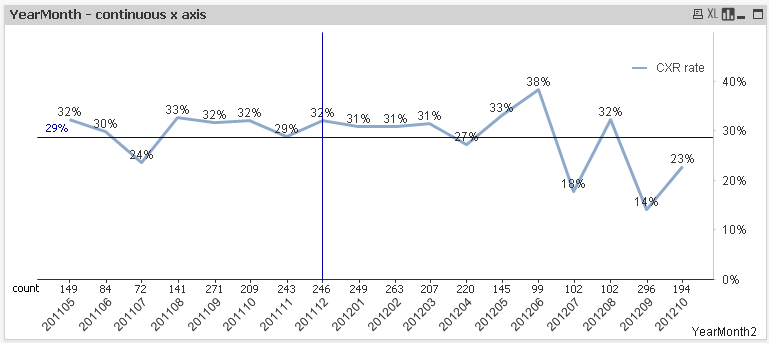
I would like to add group counts to the x-axis label like the screenshot attached. I think dual function can be used in dimension definition, but just do not know how to implement it.
Thanks
Longmatch
- Mark as New
- Bookmark
- Subscribe
- Mute
- Subscribe to RSS Feed
- Permalink
- Report Inappropriate Content
Something like this:
=dual( DimensionName & ' (' & aggr(count(MyField),DimensionName) & ')', DimensionName)
talk is cheap, supply exceeds demand
- Mark as New
- Bookmark
- Subscribe
- Mute
- Subscribe to RSS Feed
- Permalink
- Report Inappropriate Content
I tried with your idea, but it does not work. Could you please check the sample in the attachment? Thanks
- Mark as New
- Bookmark
- Subscribe
- Mute
- Subscribe to RSS Feed
- Permalink
- Report Inappropriate Content
It worked when it changed back to non-continuous axis. However, I do need this feature for continuous axis since the vertical line requires continuous axis. Can we still get it done? Thanks
- Mark as New
- Bookmark
- Subscribe
- Mute
- Subscribe to RSS Feed
- Permalink
- Report Inappropriate Content
Not very prettily. You can add another expression for the count, make the line invisible and check the option Text on Axis. Looks something like this:

talk is cheap, supply exceeds demand
- Mark as New
- Bookmark
- Subscribe
- Mute
- Subscribe to RSS Feed
- Permalink
- Report Inappropriate Content
Thanks. This solution is working and I will keep looking for other possibilities.
- Mark as New
- Bookmark
- Subscribe
- Mute
- Subscribe to RSS Feed
- Permalink
- Report Inappropriate Content
Thanks for the great information! I'm new to Qlikview (still learning). I'm wondering how you were able to enter the word 'count' on the graph? I have several graphs that I have counts on the x axis but have yet to figure out how to enter a label like you did? Thanks!