Unlock a world of possibilities! Login now and discover the exclusive benefits awaiting you.
- Qlik Community
- :
- All Forums
- :
- QlikView App Dev
- :
- How to add multiple non related fields in pie char...
Options
- Subscribe to RSS Feed
- Mark Topic as New
- Mark Topic as Read
- Float this Topic for Current User
- Bookmark
- Subscribe
- Mute
- Printer Friendly Page
Turn on suggestions
Auto-suggest helps you quickly narrow down your search results by suggesting possible matches as you type.
Showing results for
Creator
2015-11-05
11:50 PM
- Mark as New
- Bookmark
- Subscribe
- Mute
- Subscribe to RSS Feed
- Permalink
- Report Inappropriate Content
How to add multiple non related fields in pie chart expression field
| ID | element1 | element2 | element3 | element4 |
|---|---|---|---|---|
| A01 | 1.3 | 23 | 4.5 | 5 |
| A02 | 1.4 | 26 | 4.8 | 3 |
| A03 | .8 | 28 | 5 | 2.3 |
| A04 | 1.9 | 22 | 4.3 | 2.1 |
I want create a pie chart for the above mentioned data.
Whenever I select a ID Piechart should be show the values of element1 to element4.
Please guide how to do?
Thanks in advance.
- Tags:
- new_to_qlikview
389 Views
2 Replies
MVP
2015-11-06
07:44 AM
- Mark as New
- Bookmark
- Subscribe
- Mute
- Subscribe to RSS Feed
- Permalink
- Report Inappropriate Content
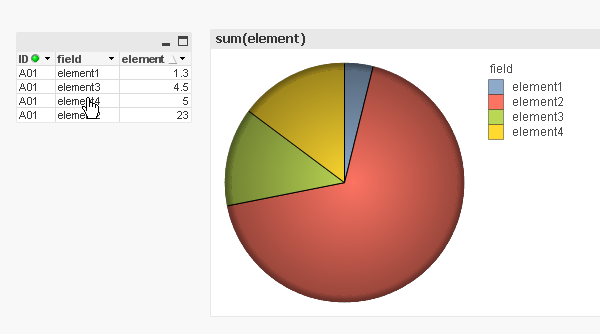
like this?

a:
LOAD
ID, element1, element2, element3, element4
FROM
[https://community.qlik.com/thread/190538]
(html, codepage is 1252, embedded labels, table is @1);
b:
CrossTable (field, element) LOAD * Resident a;
DROP Table a;
324 Views
Anonymous
Not applicable
2015-11-06
07:50 AM
- Mark as New
- Bookmark
- Subscribe
- Mute
- Subscribe to RSS Feed
- Permalink
- Report Inappropriate Content
First Create Crosstable(Element, Values)
Then take pie chart with Element as Dim
Expression: sum(Values)
Now, whenever you select ID, you will be getting associated Elements values...