Unlock a world of possibilities! Login now and discover the exclusive benefits awaiting you.
- Qlik Community
- :
- All Forums
- :
- QlikView App Dev
- :
- Re: How to add/show two or more trend lines in sca...
- Subscribe to RSS Feed
- Mark Topic as New
- Mark Topic as Read
- Float this Topic for Current User
- Bookmark
- Subscribe
- Mute
- Printer Friendly Page
- Mark as New
- Bookmark
- Subscribe
- Mute
- Subscribe to RSS Feed
- Permalink
- Report Inappropriate Content
How to add/show two or more trend lines in scatter plot?
Hello All,
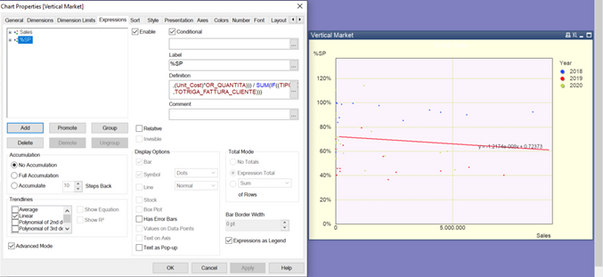
I am developing a scatter chart that shows Sales Value in X axis and SP% in Y axis(Expressions) based on years 2018, 2019, and 2020(Dimensions). I want to show trend lines for each of these years. Is it possible? In the Trendline, when I gave Linear, it shows Trendline for all the years included. But is it possible to show separate Trendline for 2018, a a separate trendline for 2019 and a separate one for 2020?
Expected Output:
I need to show trendline like below in QlikView. This shows trendline for 2018 and one for 2019 seperately.
- « Previous Replies
-
- 1
- 2
- Next Replies »
- Mark as New
- Bookmark
- Subscribe
- Mute
- Subscribe to RSS Feed
- Permalink
- Report Inappropriate Content
@Hariprasath2394 Might be possible using expressions... would you be able to share a sample to check this out?
- Mark as New
- Bookmark
- Subscribe
- Mute
- Subscribe to RSS Feed
- Permalink
- Report Inappropriate Content
Hi @sunny_talwar . Sure. This is the file from my company's software. I will recreate with a sample data in my personal laptop and share you the file in a short while.
- Mark as New
- Bookmark
- Subscribe
- Mute
- Subscribe to RSS Feed
- Permalink
- Report Inappropriate Content
Hi @sunny_talwar . Please find the attached qvw file for the scatters.
- Mark as New
- Bookmark
- Subscribe
- Mute
- Subscribe to RSS Feed
- Permalink
- Report Inappropriate Content
@Hariprasath2394 I tried doing this, but was not able to figure it out. @Kushal_Chawda or @tresesco can one of you provide your inputs?
- Mark as New
- Bookmark
- Subscribe
- Mute
- Subscribe to RSS Feed
- Permalink
- Report Inappropriate Content
@sunny_talwar @Hariprasath2394 will look into it
- Mark as New
- Bookmark
- Subscribe
- Mute
- Subscribe to RSS Feed
- Permalink
- Report Inappropriate Content
Thank you @sunny_talwar @Kushal_Chawda . I searched if anyone asked the same question related to this topic but I've not able to find one.
- Mark as New
- Bookmark
- Subscribe
- Mute
- Subscribe to RSS Feed
- Permalink
- Report Inappropriate Content
@Hariprasath2394 see the attached
- Mark as New
- Bookmark
- Subscribe
- Mute
- Subscribe to RSS Feed
- Permalink
- Report Inappropriate Content
@Hariprasath2394 See the updated attached. If you don't want to hardcode year. But still you need to create the expression for each year. So you can probably restrict it to last 3 years or 4. so that you don't need to update expression again.
- Mark as New
- Bookmark
- Subscribe
- Mute
- Subscribe to RSS Feed
- Permalink
- Report Inappropriate Content
Hello @Kushal_Chawda . Thanks a lot for your solution. It really looks great. And sorry for replying late to you as I was in sick leave for past week. I tried in my tool with my data. Actually I have given you the data which had SP in percentage value, Sales in Euros but in my actual data the values are just numeric. And the SP is not in % value instead I need to use formula like (Sales-(Cost*Quantity))/Sales to get my SP value and I need to convert them in percentage in number column. So, I am finding it so difficult to change it accordingly as even if i try multiple options, it isn't working for me. I have attached my file and the excel sheet for your reference.
If you see my result, it shows the description and %SP in labels and not the years like it shows for you.
And one more doubt, in your result, you have given years to select in Current selection bar but if I click a specific year eg.,2018, the scatter is not showing correctly. Do you know why?
Can you please try it during your free time and let me know whether you are able to correct it? Thanks a lot in advance for your help.
- « Previous Replies
-
- 1
- 2
- Next Replies »


