Unlock a world of possibilities! Login now and discover the exclusive benefits awaiting you.
- Qlik Community
- :
- All Forums
- :
- QlikView App Dev
- :
- How to calculate a trend line with conditions?
- Subscribe to RSS Feed
- Mark Topic as New
- Mark Topic as Read
- Float this Topic for Current User
- Bookmark
- Subscribe
- Mute
- Printer Friendly Page
- Mark as New
- Bookmark
- Subscribe
- Mute
- Subscribe to RSS Feed
- Permalink
- Report Inappropriate Content
How to calculate a trend line with conditions?
Dear all,
I try to calculated trend lines for several sales figures by expressions and conditions within my project.
The trend lines should only consider the past and no future values.
But it's possible, that there are month without sales.
My problem is, the calculated result is different to the out of the box trend line function and to my excel validation?
I tried already several expressions without getting the right solution.
One major thing could be, that I display only a limited number of Month in my App. In regular the last n months.
I would be thankful for some help. Please have also a look on my example.
Many thanks and best regards,
Claus
- Tags:
- linear trendline
Accepted Solutions
- Mark as New
- Bookmark
- Subscribe
- Mute
- Subscribe to RSS Feed
- Permalink
- Report Inappropriate Content
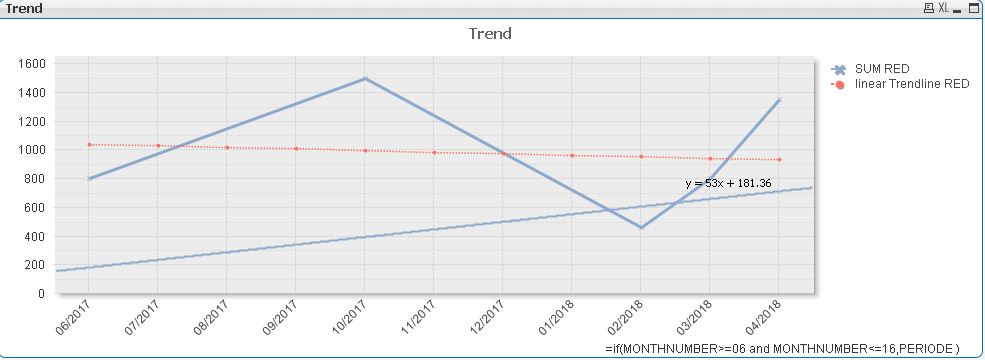
I think I get the error...
Due to the limitation of the displayed time dimension of some selected month
=if(MONTHNUMBER>=06 and MONTHNUMBER<=16,PERIODE )
I must do the time limitation also in my expression within the first if condition:
=linest_m(total aggr(if(sum(if(MONTHNUMBER>=06 and MONTHNUMBER<=16, VALUE)),sum(if( CONDITION='RED', VALUE))),MONTHNUMBER),MONTHNUMBER)
*only({1}MONTHNUMBER)
+linest_b(total aggr(if(sum(if(MONTHNUMBER>=06 and MONTHNUMBER<=16,VALUE)),sum(if( CONDITION='RED', VALUE))) ,MONTHNUMBER),MONTHNUMBER)
After doing that the calculated trend line is exactly the same as the out of the box trend line!
Many thanks for your support, Oliver!
Best regards,
Claus
- Mark as New
- Bookmark
- Subscribe
- Mute
- Subscribe to RSS Feed
- Permalink
- Report Inappropriate Content
Hi,
the out of the box linear trend line is based upon dimension and data displayed.
it's so calculated upon last n months
so you'll have I think to display manually your trend with linest_ functions
example :
=LINEST_M(aggr(sum(your measure),monthnumber),monthnumber) * monthnumber
+ LINEST_B(aggr(sum(your measure),monthnumber),monthnumber)
regards
- Mark as New
- Bookmark
- Subscribe
- Mute
- Subscribe to RSS Feed
- Permalink
- Report Inappropriate Content
Thank you for your reply.
As you can see in my example I already tried the LINEST functions.
But the result is unfortunately different to the out of the box function and I think there is an error in my expression.
Best regards,
Claus
- Mark as New
- Bookmark
- Subscribe
- Mute
- Subscribe to RSS Feed
- Permalink
- Report Inappropriate Content
Hi Claus,
I can't read your example (got QV free version),
could you just give your expression used with linest_
regards
- Mark as New
- Bookmark
- Subscribe
- Mute
- Subscribe to RSS Feed
- Permalink
- Report Inappropriate Content
Hi Olivier,
in my example I use the following expression:
=linest_m(total aggr(if(sum(VALUE),sum(if( CONDITION='RED', VALUE))),MONTHNUMBER),MONTHNUMBER)
*only({1}MONTHNUMBER)
+linest_b(total aggr(if(sum(VALUE),sum(if( CONDITION='RED', VALUE))) ,MONTHNUMBER),MONTHNUMBER)
I want to calculate the trend for the SUM of all Values with the condition RED.
I calculate the displayed Month by Monthnumber within the Dimension.
E.g. =if(MONTHNUMBER>=06 and MONTHNUMBER<=16,PERIODE )
My data includes VALUES for further, not displayed Month.
I wonder why the result is different from the out of the box function.
Due to formatting reasons I want to use a calculated trend and not the out of the box function.
I found already some hints here: Forecasting in Qlikview
But the solution is not solving my problem...
Best regards,
Claus
- Mark as New
- Bookmark
- Subscribe
- Mute
- Subscribe to RSS Feed
- Permalink
- Report Inappropriate Content
maybe you could try this (which take account of all values and not selection) :
linest_m({1} total aggr({1} sum( {<CONDITION = {red} >} VALUE),MONTHNUMBER),MONTHNUMBER)
*only({1}MONTHNUMBER)
when {1} after linest_ and after aggr, that disregards current selection
regards
- Mark as New
- Bookmark
- Subscribe
- Mute
- Subscribe to RSS Feed
- Permalink
- Report Inappropriate Content
Many thanks, but the formula leads into an error...
I tried instead:
=linest_m({1} total aggr( sum( {1<CONDITION = {'RED'} >} VALUE),MONTHNUMBER),MONTHNUMBER)
*only({1}MONTHNUMBER)
+ linest_m({1} total aggr( sum( {1<CONDITION = {'RED'} >} VALUE),MONTHNUMBER),MONTHNUMBER)
--> The result is wrong because the trend line is too low.
and
=linest_m({1} total aggr(if(sum(VALUE),sum({1}{< CONDITION={'RED'} >} VALUE)),MONTHNUMBER),MONTHNUMBER)
*only({1}MONTHNUMBER)
+linest_b({1} total aggr(if(sum(VALUE),sum({1}{< CONDITION={'RED'} >} VALUE)) ,MONTHNUMBER),MONTHNUMBER)
--> The result leads into the same trend line as the above posted expression without {1}.
- Mark as New
- Bookmark
- Subscribe
- Mute
- Subscribe to RSS Feed
- Permalink
- Report Inappropriate Content
first one should be good, but with {1} too after aggr(
what sort of error have you got ? {1} should not lead to an error
- Mark as New
- Bookmark
- Subscribe
- Mute
- Subscribe to RSS Feed
- Permalink
- Report Inappropriate Content
linest_m({1} total aggr({1} sum(... leads into an expression error.
Due to this I changed the expression into linest_m({1} total aggr( sum( {1<CONDITION = {'RED'} >} ...
But in that case the result is wrong. The displayed trend line is close to the zero line.
Best regards,
Claus
- Mark as New
- Bookmark
- Subscribe
- Mute
- Subscribe to RSS Feed
- Permalink
- Report Inappropriate Content
I think I get the error...
Due to the limitation of the displayed time dimension of some selected month
=if(MONTHNUMBER>=06 and MONTHNUMBER<=16,PERIODE )
I must do the time limitation also in my expression within the first if condition:
=linest_m(total aggr(if(sum(if(MONTHNUMBER>=06 and MONTHNUMBER<=16, VALUE)),sum(if( CONDITION='RED', VALUE))),MONTHNUMBER),MONTHNUMBER)
*only({1}MONTHNUMBER)
+linest_b(total aggr(if(sum(if(MONTHNUMBER>=06 and MONTHNUMBER<=16,VALUE)),sum(if( CONDITION='RED', VALUE))) ,MONTHNUMBER),MONTHNUMBER)
After doing that the calculated trend line is exactly the same as the out of the box trend line!
Many thanks for your support, Oliver!
Best regards,
Claus