Unlock a world of possibilities! Login now and discover the exclusive benefits awaiting you.
Announcements
Join us to spark ideas for how to put the latest capabilities into action. Register here!
- Qlik Community
- :
- All Forums
- :
- QlikView App Dev
- :
- How to create a candlestick chart???
Options
- Subscribe to RSS Feed
- Mark Topic as New
- Mark Topic as Read
- Float this Topic for Current User
- Bookmark
- Subscribe
- Mute
- Printer Friendly Page
Turn on suggestions
Auto-suggest helps you quickly narrow down your search results by suggesting possible matches as you type.
Showing results for
Not applicable
2014-08-18
10:55 AM
- Mark as New
- Bookmark
- Subscribe
- Mute
- Subscribe to RSS Feed
- Permalink
- Report Inappropriate Content
How to create a candlestick chart???
I am a starter to use qlikview, plz give a suggestion to me in order to make a candlestick chart.
I have such excel file
| TIME | LAST |
| 09:14:29.528551 | 22951 |
| 09:15:29.614293 | 22961 |
| 09:15:29.639119 | 22968 |
| 09:15:29.641101 | 22951 |
| 09:15:29.878346 | 22975 |
| 09:15:29.882078 | 22978 |
| 09:15:29.884098 | 22979 |
| 09:15:30.007220 | 22965 |
| 09:15:30.024216 | 22980 |
| 09:15:30.026978 | 22979 |
| 09:15:30.105209 | 22980 |
| 09:15:30.236066 | 22967 |
| 09:15:30.322187 | 22978 |
| 09:15:30.372227 | 22980 |
| 09:15:30.512260 | 22983 |
| 09:15:30.742066 | 22970 |
| 09:15:30.744072 | 22963 |
| 09:15:30.959001 | 22970 |
| 09:15:31.110226 | 22968 |
| 09:15:31.128118 | 22967 |
| 09:15:31.530215 | 22967 |
| 09:15:32.200263 | 22964 |
| 09:15:32.416145 | 22956 |
| 09:15:32.768265 | 22970 |
| 09:15:33.356351 | 22959 |
| 09:15:33.423385 | 22960 |
| 09:15:33.742317 | 22954 |
| 09:15:34.533320 | 22954 |
| 09:15:34.829320 | 22955 |
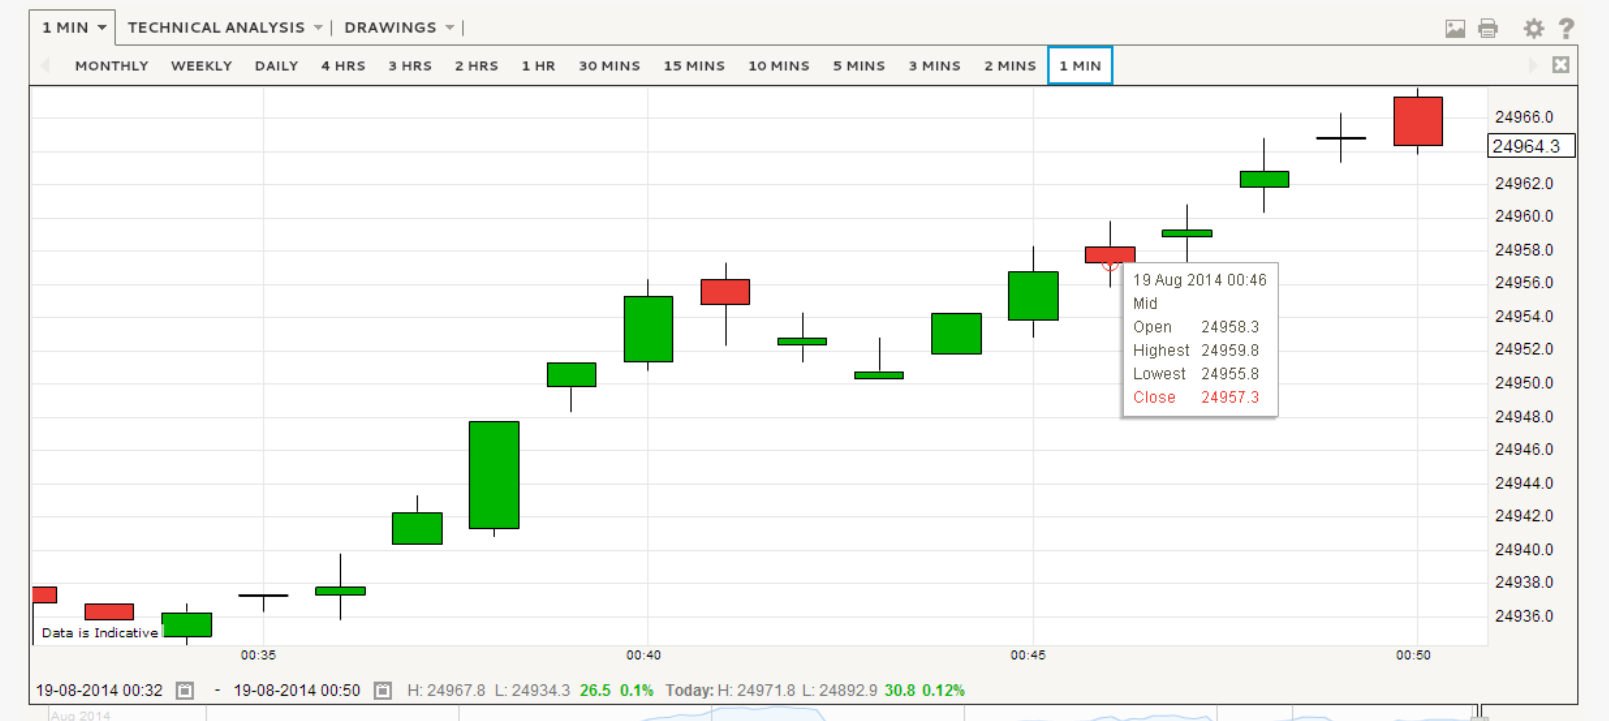
I wanna return it into like this in period of one min.

I don't know how to write the expression in order ti generate this chart.
- « Previous Replies
- Next Replies »
20 Replies
Partner - Champion III
2014-08-25
08:41 AM
- Mark as New
- Bookmark
- Subscribe
- Mute
- Subscribe to RSS Feed
- Permalink
- Report Inappropriate Content
Terrance
I suggest that you open an new thread, but to start you off, you should be able to use FirstSortedValue(LAST, Date) and FirstSortedValue(LAST, -Date) to get the 2 values, and set the background colour of the expression based on the comparison of these two value.
HTH
Jonathan
Edit = you might want to get the daily opening and closing value in script, rather than in the expression.
Logic will get you from a to b. Imagination will take you everywhere. - A Einstein
343 Views
- « Previous Replies
- Next Replies »