Unlock a world of possibilities! Login now and discover the exclusive benefits awaiting you.
- Qlik Community
- :
- All Forums
- :
- QlikView
- :
- How to create a pie chart with positive and negati...
- Subscribe to RSS Feed
- Mark Topic as New
- Mark Topic as Read
- Float this Topic for Current User
- Bookmark
- Subscribe
- Mute
- Printer Friendly Page
- Mark as New
- Bookmark
- Subscribe
- Mute
- Subscribe to RSS Feed
- Permalink
- Report Inappropriate Content
How to create a pie chart with positive and negative values
Hi all,
I have to create pie charts of 11 products in 4 different regions, but one of the pie is not visible its showing error "Positive and Negative values in chart" i know that there are some negative values in the data, but can any one tell how to show a pie
any help is appriciated
- « Previous Replies
- Next Replies »
Accepted Solutions
- Mark as New
- Bookmark
- Subscribe
- Mute
- Subscribe to RSS Feed
- Permalink
- Report Inappropriate Content
It's possible in qlikView.
See the attached file.
- Mark as New
- Bookmark
- Subscribe
- Mute
- Subscribe to RSS Feed
- Permalink
- Report Inappropriate Content
Hi,
you certianly have an expression like SUM(YourValue) and a dimension like products or region. You can try an expression like : if(SUM(YourValue)>0,SUM(YourValue)) this will show only positive value.
You can do if(SUM(YourValue)<0,SUM(YourValue)) to show negative in another chart.
If you want to show values whenever they positive or negative, you can use : fabs(SUM(YourValue))
fabs() make values absolute.
- Mark as New
- Bookmark
- Subscribe
- Mute
- Subscribe to RSS Feed
- Permalink
- Report Inappropriate Content
Hey thanks chris, it worked, but why its not showing as negative percentage in the data label
- Mark as New
- Bookmark
- Subscribe
- Mute
- Subscribe to RSS Feed
- Permalink
- Report Inappropriate Content
Hi
I think that the one thing missing in the advice you got was the fact that it is not possible to show negative values in a pie. how would you show it ?? what does a negative slice look like ?? all of the advice you have received was a way to get around this problem by making sure there are no negative values.
Basically the answer to "how can I show negative values in a pie" is... you can not.
Etay Elazar
- Mark as New
- Bookmark
- Subscribe
- Mute
- Subscribe to RSS Feed
- Permalink
- Report Inappropriate Content
Hi
I agree with Etay. Pie charts are not useful for displaying data with a mix of positive and negative numbers. I suggest that you look at some other visualisation of the data.
Regards
Jonathan
- Mark as New
- Bookmark
- Subscribe
- Mute
- Subscribe to RSS Feed
- Permalink
- Report Inappropriate Content
Hi Etay,
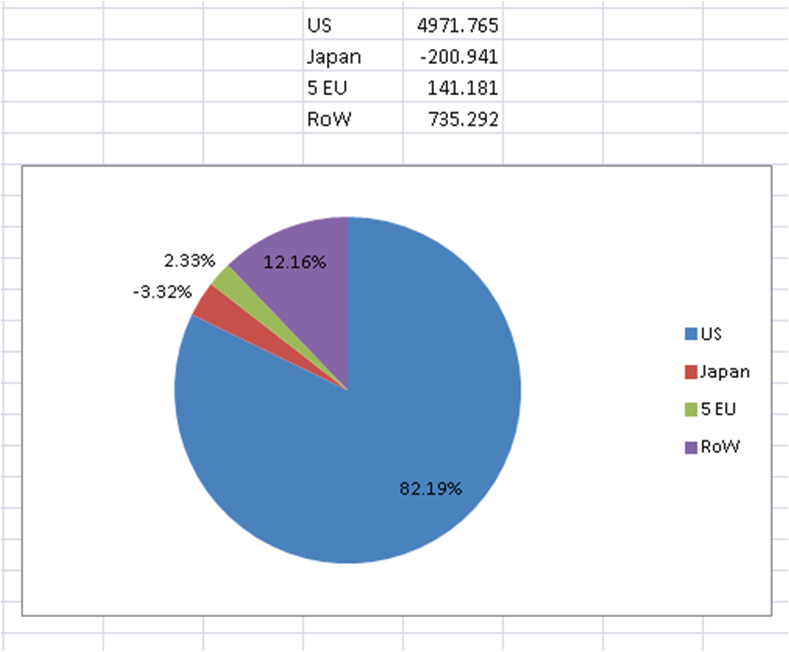
thanks alot for your reply, as u said that we can not create a pie with a negative values, i am not sure whether we can create it in QV or not but in normal Excel we can create it, plz see the attached pic
- Mark as New
- Bookmark
- Subscribe
- Mute
- Subscribe to RSS Feed
- Permalink
- Report Inappropriate Content
It's possible in qlikView.
See the attached file.
- Mark as New
- Bookmark
- Subscribe
- Mute
- Subscribe to RSS Feed
- Permalink
- Report Inappropriate Content
Hi,
You can try expression like this
=if(Sum(FieldName)>0,Sum(FieldName),Num(Fabs(Sum(FieldName)),'-###.##%'))
Celambarasan
- Mark as New
- Bookmark
- Subscribe
- Mute
- Subscribe to RSS Feed
- Permalink
- Report Inappropriate Content
Hi Chris,
I am using a PE version of QV, so can not open your file, it would be great if you can write me back what you have done
- Mark as New
- Bookmark
- Subscribe
- Mute
- Subscribe to RSS Feed
- Permalink
- Report Inappropriate Content
Chris has written like this..
In edit script:
LOAD * INLINE [
Country, Score
US, 4971.765
Japan, -200.941
5 EU, 141.181
RoW, 735.292
];
In front end, Straight table or pic chart
Dimension as Country
Expresssions:
first expression -> =fabs(sum(Score))
second expressino -> =sum(Score)
If you want to see 2nd expr as in % check on Relative box in expression tab.
- « Previous Replies
- Next Replies »