Unlock a world of possibilities! Login now and discover the exclusive benefits awaiting you.
- Qlik Community
- :
- All Forums
- :
- QlikView App Dev
- :
- How to disply label names for the 2 cyclic groups ...
- Subscribe to RSS Feed
- Mark Topic as New
- Mark Topic as Read
- Float this Topic for Current User
- Bookmark
- Subscribe
- Mute
- Printer Friendly Page
- Mark as New
- Bookmark
- Subscribe
- Mute
- Subscribe to RSS Feed
- Permalink
- Report Inappropriate Content
How to disply label names for the 2 cyclic groups of bar chart
Hi,
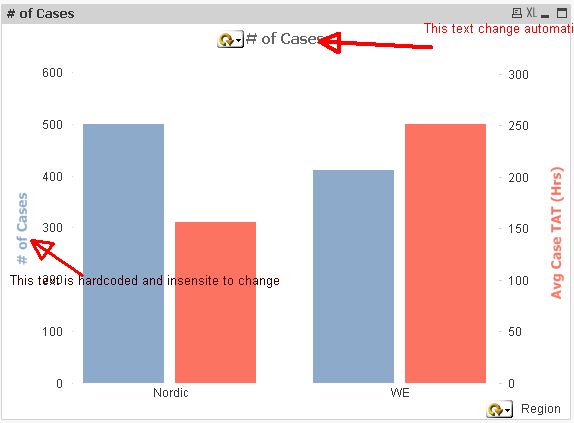
I have a bar chart with 2 cyclic groups , and i selected 1 dimension and 1 metric from each cyclic group , so it is showing graph (Please find the attachment) based on the color of the metric , but my issue is i have to disply metric names accordingly in both axis
please let me know Is this possible ?
Thanks,
Sh
- Mark as New
- Bookmark
- Subscribe
- Mute
- Subscribe to RSS Feed
- Permalink
- Report Inappropriate Content
Hi Rani,
on your picture there are two cyclic 'buttons'. As I assume correctly one is for Dimension and one for Metric, but on it looks like you have one extra metric that isn't grouped.
Could you please post the original .qvw file if possible?
One quick and dirty solution will be to hide Legend and show it as hardcoded text in graph (but that text will be insensitive what metric is selected, that text automatically change only in Title), see attached picture.
To display what field is currently showed in Dimension cyclic you can use GetCurrentField() function.