Unlock a world of possibilities! Login now and discover the exclusive benefits awaiting you.
- Qlik Community
- :
- All Forums
- :
- QlikView App Dev
- :
- How to get dimension value in scatter plot "Z" sca...
- Subscribe to RSS Feed
- Mark Topic as New
- Mark Topic as Read
- Float this Topic for Current User
- Bookmark
- Subscribe
- Mute
- Printer Friendly Page
- Mark as New
- Bookmark
- Subscribe
- Mute
- Subscribe to RSS Feed
- Permalink
- Report Inappropriate Content
How to get dimension value in scatter plot "Z" scale ??
Hi ,
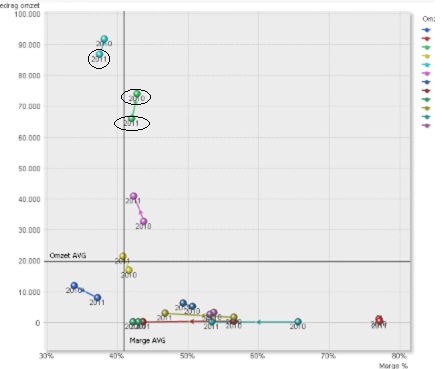
Need help in getting below scatter plot with dimension on bubble .
Attached is scatter plot of qlikview , but dont knw how to achieve it .....
I am using QV 11 SR12 .

Regards,
Bhushan N
- Mark as New
- Bookmark
- Subscribe
- Mute
- Subscribe to RSS Feed
- Permalink
- Report Inappropriate Content
If you check "Labels on DataPoints" on the Presentation tab, you will get it.
(However, the labels will not show if you have too many datapoints. You may need to make a selection to get the number down.)
HIC
- Mark as New
- Bookmark
- Subscribe
- Mute
- Subscribe to RSS Feed
- Permalink
- Report Inappropriate Content
Hi Henric ,
I already tried that , but no success .
I have only periods in my chart "Past " Vs "current" .
Also, surprising factor is labels are appearing if by any chance only one data point is present during selection .
Means , if filters selected only have Current Or past data , I can able to get data label .
So bit confuse here .