Unlock a world of possibilities! Login now and discover the exclusive benefits awaiting you.
- Qlik Community
- :
- All Forums
- :
- QlikView App Dev
- :
- How to get exactly similar output ?
- Subscribe to RSS Feed
- Mark Topic as New
- Mark Topic as Read
- Float this Topic for Current User
- Bookmark
- Subscribe
- Mute
- Printer Friendly Page
- Mark as New
- Bookmark
- Subscribe
- Mute
- Subscribe to RSS Feed
- Permalink
- Report Inappropriate Content
How to get exactly similar output ?
Hi Team ,
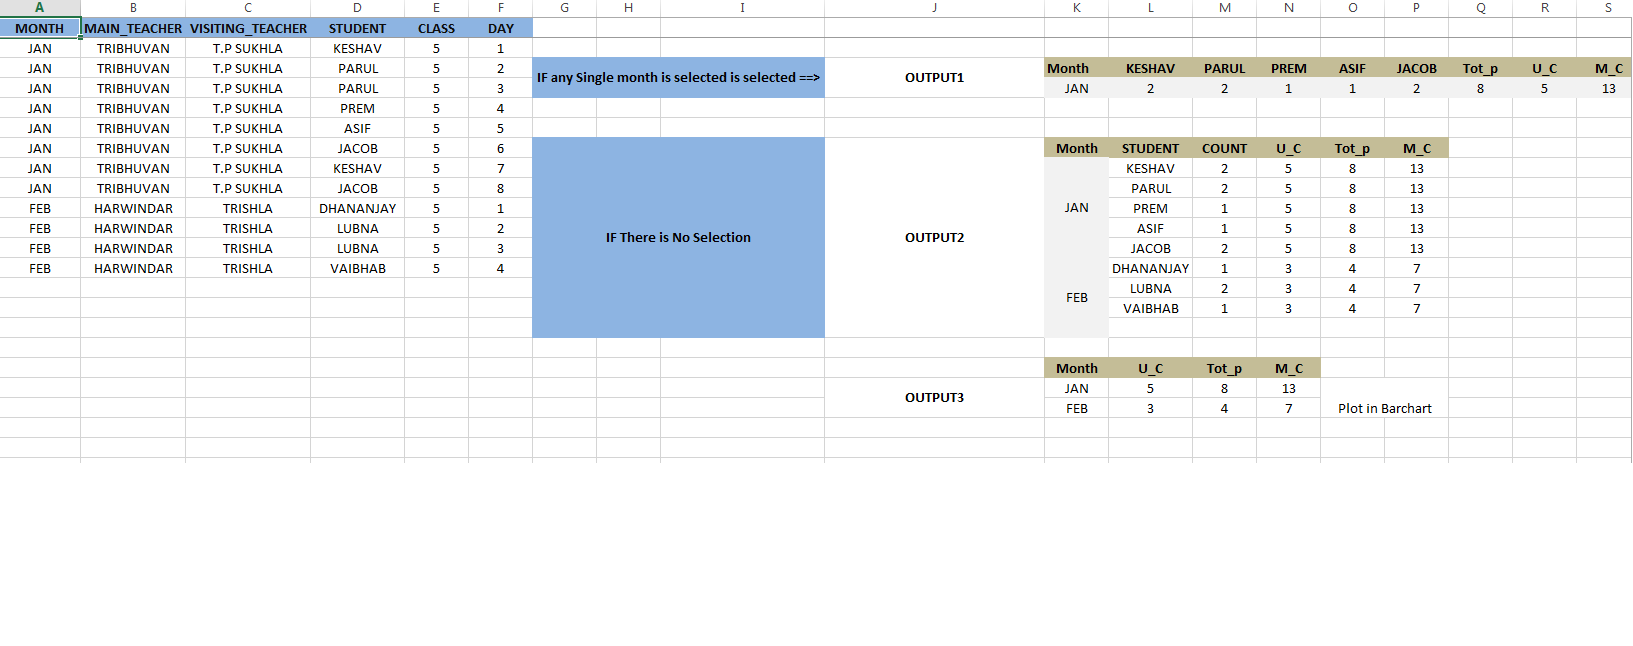
How to get output exactly similar with a simple excel data ?
OUTPUT 1 ,2 , 3 are my requirements .

Thanks & Regards
Shekar
Accepted Solutions
- Mark as New
- Bookmark
- Subscribe
- Mute
- Subscribe to RSS Feed
- Permalink
- Report Inappropriate Content
- Mark as New
- Bookmark
- Subscribe
- Mute
- Subscribe to RSS Feed
- Permalink
- Report Inappropriate Content
tresesco ..
- Mark as New
- Bookmark
- Subscribe
- Mute
- Subscribe to RSS Feed
- Permalink
- Report Inappropriate Content
Hi,
PFA
- Mark as New
- Bookmark
- Subscribe
- Mute
- Subscribe to RSS Feed
- Permalink
- Report Inappropriate Content
Hi Yosuf ,
I did not find highlighted calculation .
- Mark as New
- Bookmark
- Subscribe
- Mute
- Subscribe to RSS Feed
- Permalink
- Report Inappropriate Content
stalwar1 ..
- Mark as New
- Bookmark
- Subscribe
- Mute
- Subscribe to RSS Feed
- Permalink
- Report Inappropriate Content
What is U_C? I mean what is the logic behind U_C?
Also, you want two charts or a single chart to behave like below (with and without selection)
- Mark as New
- Bookmark
- Subscribe
- Mute
- Subscribe to RSS Feed
- Permalink
- Report Inappropriate Content
Thank Sunny Bhai for replying ......U_C is distinct count of people name .. like KESHAV , PARUAL,ASIF,JACOB,PREM--- THESE ARE FIVE DISTINCT PEOPLE IN JAN .......
Three distinct charts will also work fine for me @ this point of time ......
- Mark as New
- Bookmark
- Subscribe
- Mute
- Subscribe to RSS Feed
- Permalink
- Report Inappropriate Content
You didn't described what is the UC topP MC... maybe you should
- Mark as New
- Bookmark
- Subscribe
- Mute
- Subscribe to RSS Feed
- Permalink
- Report Inappropriate Content
sorry ...
| KESHAV | PARUL | PREM | ASIF | JACOB |
| 2 | 2 | 1 | 1 | 2 |
2+2+1+1+2 = 8 ---> Tot_p
Distinct count of Student for Jan = 5 --> U_c
8+5 = 13 --> m_c
- Mark as New
- Bookmark
- Subscribe
- Mute
- Subscribe to RSS Feed
- Permalink
- Report Inappropriate Content
This