Unlock a world of possibilities! Login now and discover the exclusive benefits awaiting you.
- Qlik Community
- :
- All Forums
- :
- QlikView App Dev
- :
- How to insert google map
- Subscribe to RSS Feed
- Mark Topic as New
- Mark Topic as Read
- Float this Topic for Current User
- Bookmark
- Subscribe
- Mute
- Printer Friendly Page
- Mark as New
- Bookmark
- Subscribe
- Mute
- Subscribe to RSS Feed
- Permalink
- Report Inappropriate Content
How to insert google map
Can any one help me out, i want to know how to insert google map in the chart, i tired doing it as per the attached PDF, but i am not able to understand it,it be great help
- Tags:
- google_api
- Mark as New
- Bookmark
- Subscribe
- Mute
- Subscribe to RSS Feed
- Permalink
- Report Inappropriate Content
Hi.
Here I leave an example.
It has a tutorial.
I got on this site.
Regards
- Mark as New
- Bookmark
- Subscribe
- Mute
- Subscribe to RSS Feed
- Permalink
- Report Inappropriate Content
hi, thanks for your reply, can u provide me with the supporting files, as i m not able to view the map in ur attachment
- Mark as New
- Bookmark
- Subscribe
- Mute
- Subscribe to RSS Feed
- Permalink
- Report Inappropriate Content
Hi,
If you want you could try out Idevio Maps as an alternative to Google Maps, it's a faster, more interactive way to use maps within Qlikview. Main benefits are:
- Fast map with dynamic zoom and pan.
- Client side rendering, handles thousands of objects with ease.
- Plug and play, easy to setup and configure.
- Extendable, the extension serves as a starting point.
- World coverage, street level for many areas.
IdevioMaps are available to Qlikview 10 as an extension object.
Visit www.idevio.com for more info and demo (logon on with demo demo).

- Mark as New
- Bookmark
- Subscribe
- Mute
- Subscribe to RSS Feed
- Permalink
- Report Inappropriate Content
take a scatter chart-> go to chart properties->Colors->image check and click on image button
add your picture of map here
- Mark as New
- Bookmark
- Subscribe
- Mute
- Subscribe to RSS Feed
- Permalink
- Report Inappropriate Content
Hi,
I am new to using Google maps on Qlikview. I was going through the help documents suggested above, but got stuck right in the beginning! My problems are as follows:
1) I have Qlikview 10 personal edition on my sysytem. Will the google map feature not work on this version?
2) When we have to sign up for the google maps API key, they ask for the URL of the website on which google maps would be used. Could you all please help me with what website do we mean here? Because I have to use it on my personal edition of Qlikview!
Looking forward to reply here!
Many Thanks,
Ritika
- Mark as New
- Bookmark
- Subscribe
- Mute
- Subscribe to RSS Feed
- Permalink
- Report Inappropriate Content
Hi,
First thing, it doesnt mean that if you have the personal edition, google map will not work. Personal edition have full functionality except that you can not open the document which are created by other user on other computer.
Have a look at the search result on this link for more help.
Hope this will help.
Regards,
Kaushik Solanki
- Mark as New
- Bookmark
- Subscribe
- Mute
- Subscribe to RSS Feed
- Permalink
- Report Inappropriate Content
Hi Kaushik,
In your convenient time could you please provide me step by step procedure to add google map into QlikView document. I have already implemented once(only once and long back) but lost the track of it completely. So could you please provide me the steps.
Thanks,
Attitude
- Mark as New
- Bookmark
- Subscribe
- Mute
- Subscribe to RSS Feed
- Permalink
- Report Inappropriate Content
Hi All,
GIS/Maps Analytics in QlikView is a very interesting topic indeed.
However, there are many technical limitations in using Google Maps (GMaps) to display QlikView KPI indicators. First of all, the drill-down, pan and selection capabilities are quite limited. Moreover, you cannot display several indicators at the same time and on the same map (background + foreground indicators), you are also limited to draw bubbles and therefore you cannot display pie/bar charts nor "real" heat maps. Finally, you cannot display QlikView KPIs on specific Sales/Business Areas with GMaps such as the Bricks in the Pharmaceutical sector (Brick = aggregation of zipcodes).
On top of that, there are also a few "commercial" aspects to be considered since many QlikView customers & channel partners use GMaps API "FREE" Key inside their QlikView server or rich client without complying with GMaps license terms...Indeed, for "professional internal use" (intranet, extranet or internet with username/password authentication to QlikView application), you must buy GMaps API "Premier" which costs about 10,000 $ USD per year or 8,500 euros per year + possible extra fees depending upon the total number of daily hits.
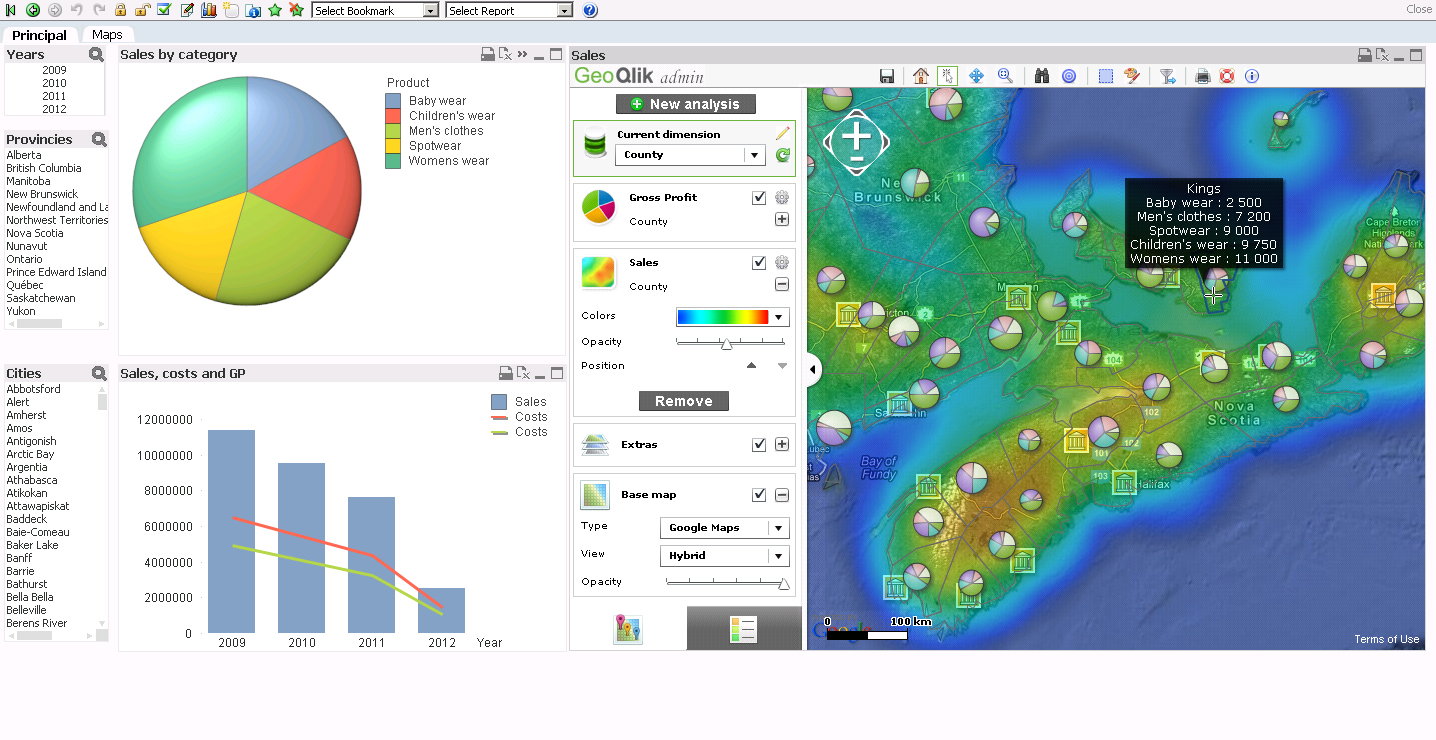
A few alternatives exist such as Open Street Map (totally FREE) or other WMS/TMS services. I suggest you to have a look at our new mapping extension for QlikView 11 SR1 namely "GeoQlik v11.6":
http://www.geoqlik.com/en/geoqlik-for-qlikview/geoqlik-v11.html
Please find hereafter a few screenshots of GeoQlik V11.6 using WMS/TMS services to display QlikView KPIs:

Thanks and best regards,
David
@ Business Geografic