Unlock a world of possibilities! Login now and discover the exclusive benefits awaiting you.
- Qlik Community
- :
- All Forums
- :
- QlikView App Dev
- :
- Re: How to label along the Axis in the bar chart ?
- Subscribe to RSS Feed
- Mark Topic as New
- Mark Topic as Read
- Float this Topic for Current User
- Bookmark
- Subscribe
- Mute
- Printer Friendly Page
- Mark as New
- Bookmark
- Subscribe
- Mute
- Subscribe to RSS Feed
- Permalink
- Report Inappropriate Content
How to label along the Axis in the bar chart ?
Hello,
I have the bar chart as shown below;
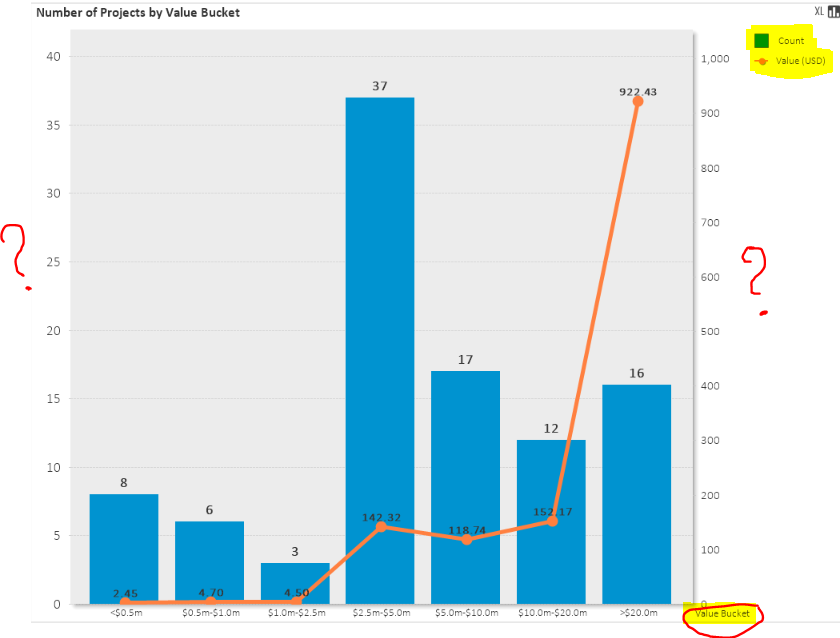
How to label (Count and Value (USD)) along both the axis in my bar chart? Also how to increase the font size of the dimension Value_Bucket?
Accepted Solutions
- Mark as New
- Bookmark
- Subscribe
- Mute
- Subscribe to RSS Feed
- Permalink
- Report Inappropriate Content
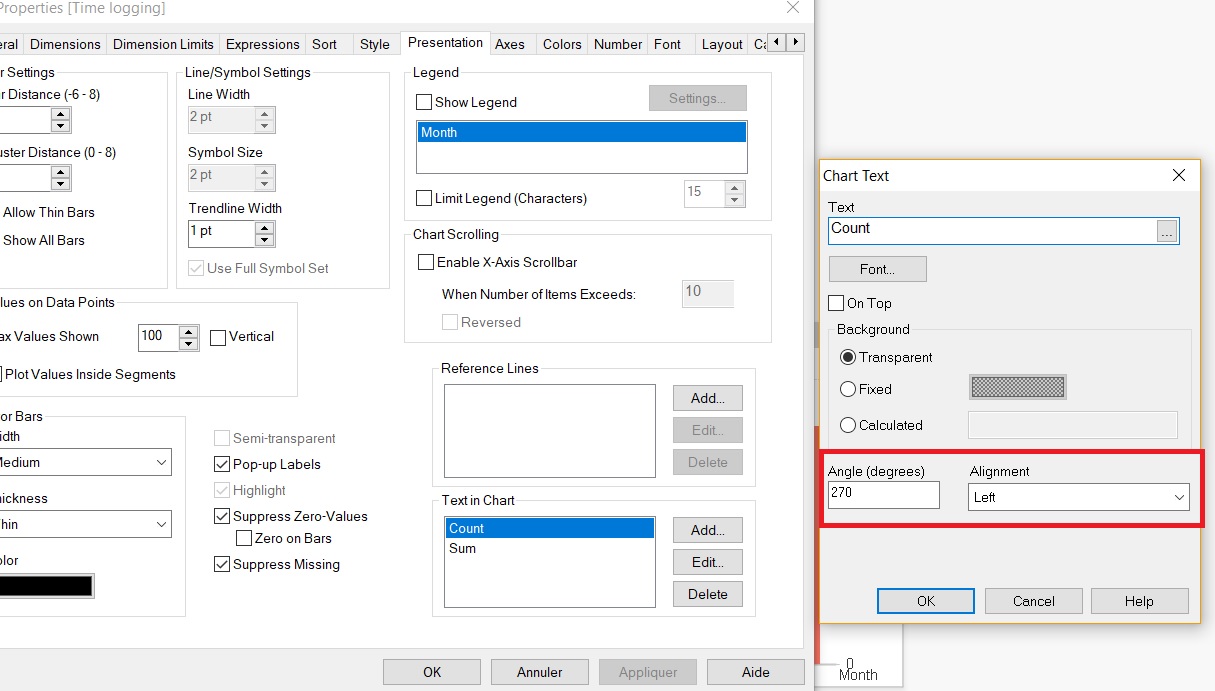
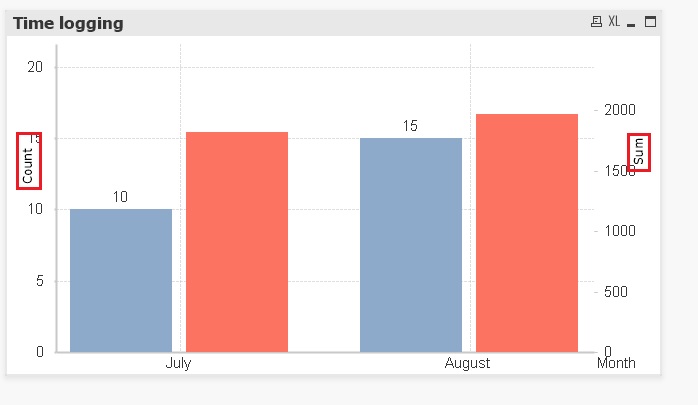
It's ok. For label on both Y axis, you can use in Presentation tab/ Text in chart. Put 90 or 270° and moove the text area Ctrl+Shift
 *
*
- Mark as New
- Bookmark
- Subscribe
- Mute
- Subscribe to RSS Feed
- Permalink
- Report Inappropriate Content
You can moove legent with select the chart -> press ctrl+shift. But for both axis, not sure you can copy a second legend.
For increase font of value bucket, go in properties/Axes/Dimension axis->Font
- Mark as New
- Bookmark
- Subscribe
- Mute
- Subscribe to RSS Feed
- Permalink
- Report Inappropriate Content
It's ok. For label on both Y axis, you can use in Presentation tab/ Text in chart. Put 90 or 270° and moove the text area Ctrl+Shift
*
- Mark as New
- Bookmark
- Subscribe
- Mute
- Subscribe to RSS Feed
- Permalink
- Report Inappropriate Content
that was really helpful. thank you for the tips 