Unlock a world of possibilities! Login now and discover the exclusive benefits awaiting you.
- Qlik Community
- :
- All Forums
- :
- QlikView App Dev
- :
- Re: How to replace flash lights instead of trend l...
- Subscribe to RSS Feed
- Mark Topic as New
- Mark Topic as Read
- Float this Topic for Current User
- Bookmark
- Subscribe
- Mute
- Printer Friendly Page
- Mark as New
- Bookmark
- Subscribe
- Mute
- Subscribe to RSS Feed
- Permalink
- Report Inappropriate Content
How to replace flash lights instead of trend lines?
Hi,
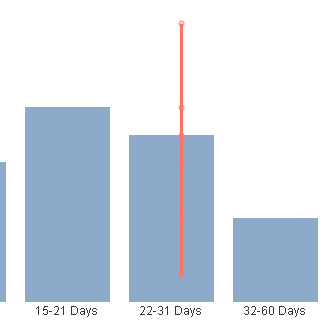
can anyone let me know this please. As I have combo chart with
Dimension1: Product
Dimension2: Range of Days
Expression1: Count(Distinct ProductID) as Bar
Expression2: Count(Distinct ProductID) as Trend line.
This will show as attached in png. I would need to show some flash light instead of trend line if it crosses 21 days. Is it possible to do this?
Thanks.
- Tags:
- new_to_qlikview
- Mark as New
- Bookmark
- Subscribe
- Mute
- Subscribe to RSS Feed
- Permalink
- Report Inappropriate Content
I found the below link from google
http://www.picgifs.com/graphics/a/alarm-lights/graphics-alarm-lights-687060.gif
But how can I use this?
- Mark as New
- Bookmark
- Subscribe
- Mute
- Subscribe to RSS Feed
- Permalink
- Report Inappropriate Content
You could use the builtin-trendlines (mid-bottom from expression tab) or try an expression like this:
avg(aggr(count(distinct ProductID), Product))
- Marcus
- Mark as New
- Bookmark
- Subscribe
- Mute
- Subscribe to RSS Feed
- Permalink
- Report Inappropriate Content
Thanks for your help. My user wants to see only flash lights whihc is in above URL. Is it possible? Please let me know.
- Mark as New
- Bookmark
- Subscribe
- Mute
- Subscribe to RSS Feed
- Permalink
- Report Inappropriate Content
Any Help please? as My user wants to see only flash lights whihc is in above URL. Is it possible? Please let me know.
- Mark as New
- Bookmark
- Subscribe
- Mute
- Subscribe to RSS Feed
- Permalink
- Report Inappropriate Content
I think this isn't possible within a bar- or line-chart then such expressions-result needed the possibility to shown as picture. If you used a straight-table or a pivot perhaps with gauge- or mini-charts instead numbers you could add an expression which displayed a picture - I'm not sure if animated pictures will be supported.
- Marcus
- Mark as New
- Bookmark
- Subscribe
- Mute
- Subscribe to RSS Feed
- Permalink
- Report Inappropriate Content
Thanks.