Unlock a world of possibilities! Login now and discover the exclusive benefits awaiting you.
- Qlik Community
- :
- All Forums
- :
- QlikView App Dev
- :
- How to show hiding / minimizing Pivot chart
- Subscribe to RSS Feed
- Mark Topic as New
- Mark Topic as Read
- Float this Topic for Current User
- Bookmark
- Subscribe
- Mute
- Printer Friendly Page
- Mark as New
- Bookmark
- Subscribe
- Mute
- Subscribe to RSS Feed
- Permalink
- Report Inappropriate Content
How to show hiding / minimizing Pivot chart
Hi all
I have declared 2 Variables Like
LET vMinDate = NUM(Date#('2014-01-01', 'YYYY-MM-DD')); //FY13 and onward
LET vMaxDate = NUM(Date#('2016-12-31', 'YYYY-MM-DD'));
Note : If i give LET vMaxDate = NUM(Date#('2015-12-31', 'YYYY-MM-DD'));
Then the chart will be displayed other wise the chart will be minimized (Hiding)
So , How can we display the chart
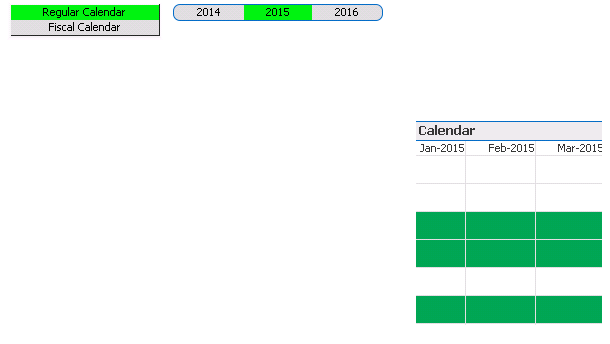
If i can't selected the year then ..it will displays like the following ..

If i selected the particular year ..it will display the chart..

So.... How can i display the chart ....If i "CLEAR" it ..
Thanks
Madhu
- Mark as New
- Bookmark
- Subscribe
- Mute
- Subscribe to RSS Feed
- Permalink
- Report Inappropriate Content
Hi,
I'm not sure if I understand the problem. Would you be able to share the application ?
- Mark as New
- Bookmark
- Subscribe
- Mute
- Subscribe to RSS Feed
- Permalink
- Report Inappropriate Content
hiding is different to minimizing
though you can add a conditional either in the layout of the document or the dimensions that you want to hide
create an if that shows "0" for whenever you want to hide it and 1 for whenever you want to show it