Unlock a world of possibilities! Login now and discover the exclusive benefits awaiting you.
- Qlik Community
- :
- All Forums
- :
- QlikView App Dev
- :
- Re: How to shown single bar in bar chart ?
- Subscribe to RSS Feed
- Mark Topic as New
- Mark Topic as Read
- Float this Topic for Current User
- Bookmark
- Subscribe
- Mute
- Printer Friendly Page
- Mark as New
- Bookmark
- Subscribe
- Mute
- Subscribe to RSS Feed
- Permalink
- Report Inappropriate Content
How to shown single bar in bar chart ?
Hi All,
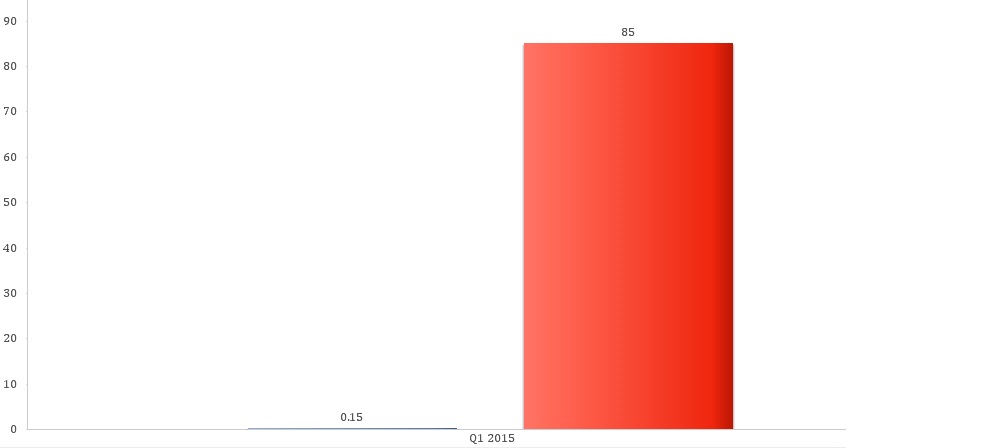
PFA the snapshot of the bar chart that I have created.
The blue bar indicates the actual % values are calculated using cummulative total of actual nos.
The red bar shows the targeted value which is available for Q1 2015 onwards only.
Now I want to show bars for 2015 only. Hence as of now only data related to Q1 2015 will be seen as first quarter is going on.
Moving ahead the rest quarter's values will be seen.
I want to remove bars for previous years. But when I restrict the dimension using calculated dimension or dimension limits tab, I do get data for 2015 but the actual values gets disturbed as shown in the "wrong data snapshot".
Please help me.
Thanks & Regards,
- Mark as New
- Bookmark
- Subscribe
- Mute
- Subscribe to RSS Feed
- Permalink
- Report Inappropriate Content
Hi Sarang,
Would it be possible for you to share your QlikView document? It will be help us to better answer you question.
Cheers
Carlos
- Mark as New
- Bookmark
- Subscribe
- Mute
- Subscribe to RSS Feed
- Permalink
- Report Inappropriate Content
Dear Carlos,
PFA the sample application.
Thanks & Regards,
- Mark as New
- Bookmark
- Subscribe
- Mute
- Subscribe to RSS Feed
- Permalink
- Report Inappropriate Content
You can try with Fabs in the load script but do this multiplication in the current table it self.
Load
Fields,,,,
Nominal_Quantity*value Newfield
From Location;
- Mark as New
- Bookmark
- Subscribe
- Mute
- Subscribe to RSS Feed
- Permalink
- Report Inappropriate Content
Dear Anand,
I am not able to understand your suggestion else I think you have replied w.r.t. some other query or post.
Please confirm.
Thanks & Regards,
- Mark as New
- Bookmark
- Subscribe
- Mute
- Subscribe to RSS Feed
- Permalink
- Report Inappropriate Content
Dear Carlos,
Sincere request to help me if possible.
I have already attached the application.
Thanks & Regards,
- Mark as New
- Bookmark
- Subscribe
- Mute
- Subscribe to RSS Feed
- Permalink
- Report Inappropriate Content
In your expression (Achieved retention), you are using above(). When you limit your dimension this above() gets nothing to refer. To work with such requirement you have to use Aggr(). Your expression is too long ! I am too lazy to work with it.  . Try with Aggr().
- Mark as New
- Bookmark
- Subscribe
- Mute
- Subscribe to RSS Feed
- Permalink
- Report Inappropriate Content
Dear Tresesco,
I have to use above () as I am using the closing balance of previous month for the opening balance of next month.
Please Suggest if something else can be done.
Regards,
Sarang M. Mehta
Sent from Samsung Mobile
Please excuse the brevity of the message
- Mark as New
- Bookmark
- Subscribe
- Mute
- Subscribe to RSS Feed
- Permalink
- Report Inappropriate Content
See here how aggr() can be used to refer previous row which is not in the scope of display of a chart.: Calculating rolling n-period totals, averages or other aggregations