Unlock a world of possibilities! Login now and discover the exclusive benefits awaiting you.
- Qlik Community
- :
- All Forums
- :
- QlikView App Dev
- :
- How to transform a stacked chart into a grouped ba...
- Subscribe to RSS Feed
- Mark Topic as New
- Mark Topic as Read
- Float this Topic for Current User
- Bookmark
- Subscribe
- Mute
- Printer Friendly Page
- Mark as New
- Bookmark
- Subscribe
- Mute
- Subscribe to RSS Feed
- Permalink
- Report Inappropriate Content
How to transform a stacked chart into a grouped bar chart
Hi guys! How do I transform a stacked chart into a grouped chart even if it has 2 dimensions. I only have 1 expression and I tried to do by simply changing the style at the properties tab however it didn't display the chart I wanted.
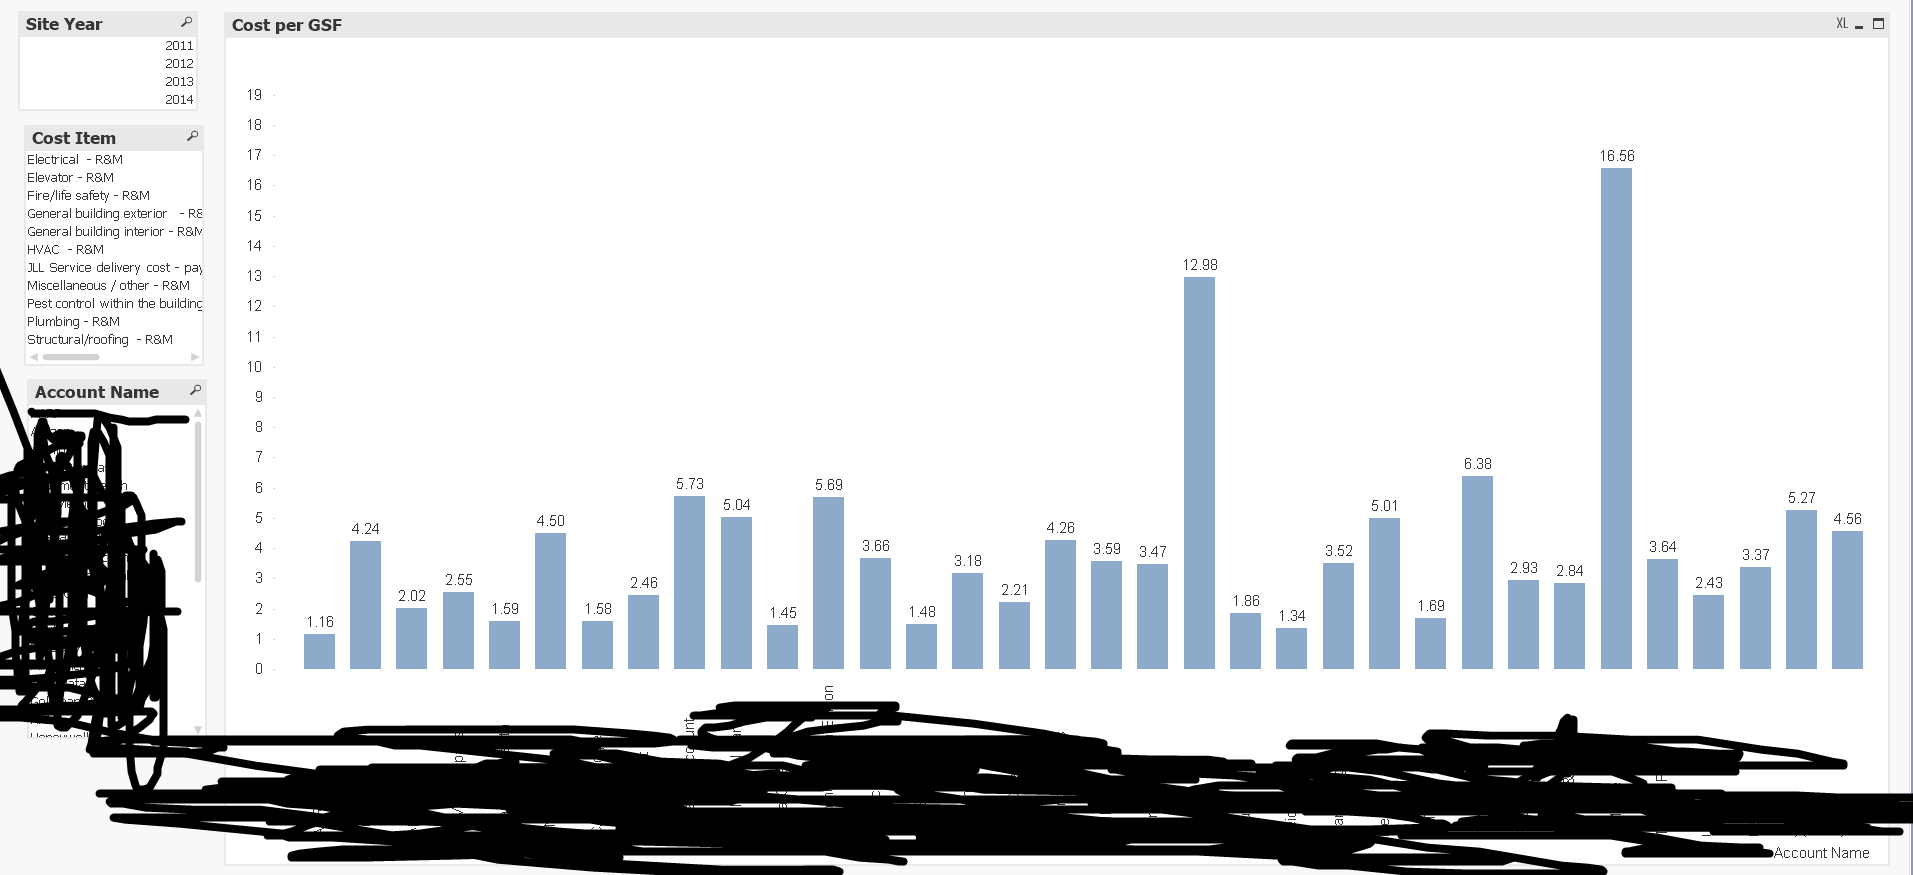
This the result I wanted to:

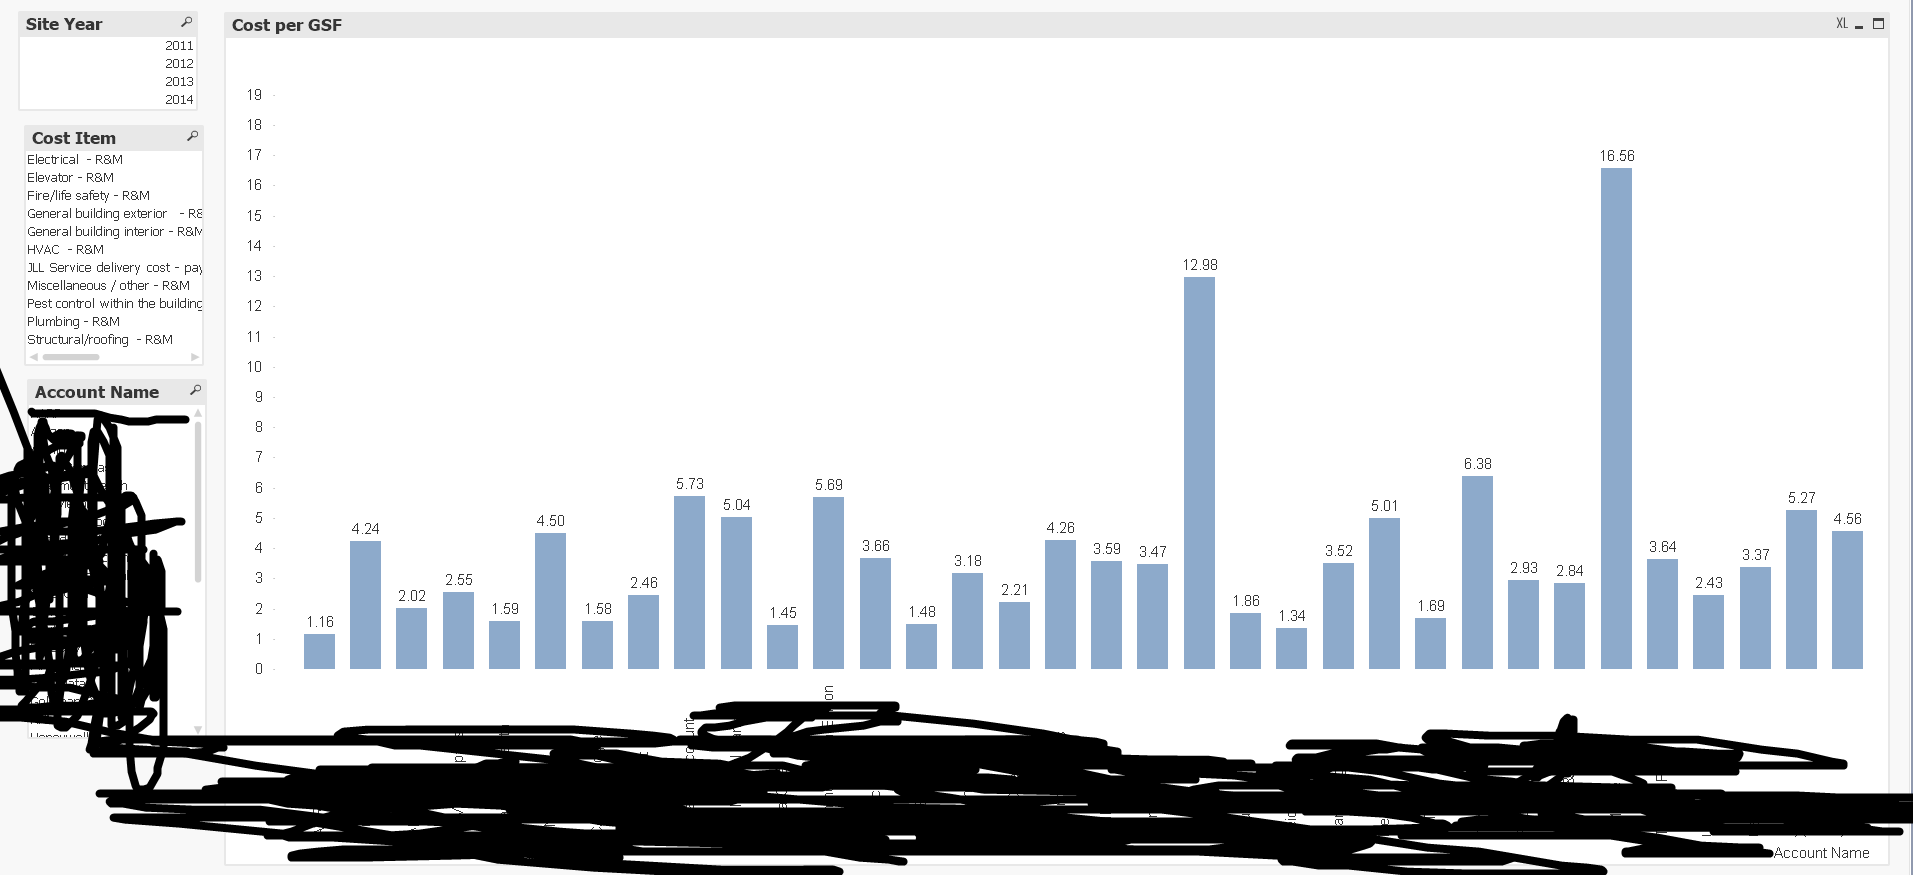
But instead I'm getting this:
Help me on this please. Thanks in advance!
- « Previous Replies
-
- 1
- 2
- Next Replies »
- Mark as New
- Bookmark
- Subscribe
- Mute
- Subscribe to RSS Feed
- Permalink
- Report Inappropriate Content
Can you explain the requirement bit in detail? also try providing some sample data with expected output.
- Mark as New
- Bookmark
- Subscribe
- Mute
- Subscribe to RSS Feed
- Permalink
- Report Inappropriate Content
I wanted to present my data in a grouped bar chart. The Expression I used is Aggr(Avg([Cost/GSF]),[Account Name],[Cost Item]). The Style of my chart is grouped. I have to present a one colored grouped bar chart but instead I was presented with this:
Whereas expected output is this:

Thanks in advance for your help sir.
- Mark as New
- Bookmark
- Subscribe
- Mute
- Subscribe to RSS Feed
- Permalink
- Report Inappropriate Content
Hi,
Hope you went to style tab and changed the subtype from Stacked to Grouped.
Regards,
Kaushik Solanki
- Mark as New
- Bookmark
- Subscribe
- Mute
- Subscribe to RSS Feed
- Permalink
- Report Inappropriate Content
I already did Sir. I'm still getting a chart which has the colors for all legends. What I wanted is a one colored chart.
- Mark as New
- Bookmark
- Subscribe
- Mute
- Subscribe to RSS Feed
- Permalink
- Report Inappropriate Content
Its not very clear what you want. The requirement you describe should have only one dimension and one expression. So just remove the second dimension. Or am I missing something?
- Mark as New
- Bookmark
- Subscribe
- Mute
- Subscribe to RSS Feed
- Permalink
- Report Inappropriate Content
Hi,
By Default when you add two dimension it will get spit by color, so that one can easily bifurcate them.
But if you want everything in one color, all you need to do is click on the + sign next to your expression under expression tab.
Here you will find an option to change the background color.
click on it and on right side you can add the color of your choice using any color function like rgb() in definition.
This will assign single color to all of your bars.
Regards,
Kaushik Solanki
- Mark as New
- Bookmark
- Subscribe
- Mute
- Subscribe to RSS Feed
- Permalink
- Report Inappropriate Content
I have two dimensions for this Sir, the account name and the cost item. I wanted to have a grouped chart which has only one color. I tried removing Account Name as dimension but the chart being displayed had only one account name on the x axis.
- Mark as New
- Bookmark
- Subscribe
- Mute
- Subscribe to RSS Feed
- Permalink
- Report Inappropriate Content
I see sir, but it's not just one color but the values on the data points should be correct as well, apparently I can't get it right. If I removed any one of the dimensions, the chart turns out to be very different from the expected output.
- Mark as New
- Bookmark
- Subscribe
- Mute
- Subscribe to RSS Feed
- Permalink
- Report Inappropriate Content
Hi Kat,
Is this what you are looking for ?
Br,
KC
KC
- « Previous Replies
-
- 1
- 2
- Next Replies »