Unlock a world of possibilities! Login now and discover the exclusive benefits awaiting you.
- Qlik Community
- :
- All Forums
- :
- QlikView App Dev
- :
- Re: I'm having a dash (-) on my x axis in the char...
- Subscribe to RSS Feed
- Mark Topic as New
- Mark Topic as Read
- Float this Topic for Current User
- Bookmark
- Subscribe
- Mute
- Printer Friendly Page
- Mark as New
- Bookmark
- Subscribe
- Mute
- Subscribe to RSS Feed
- Permalink
- Report Inappropriate Content
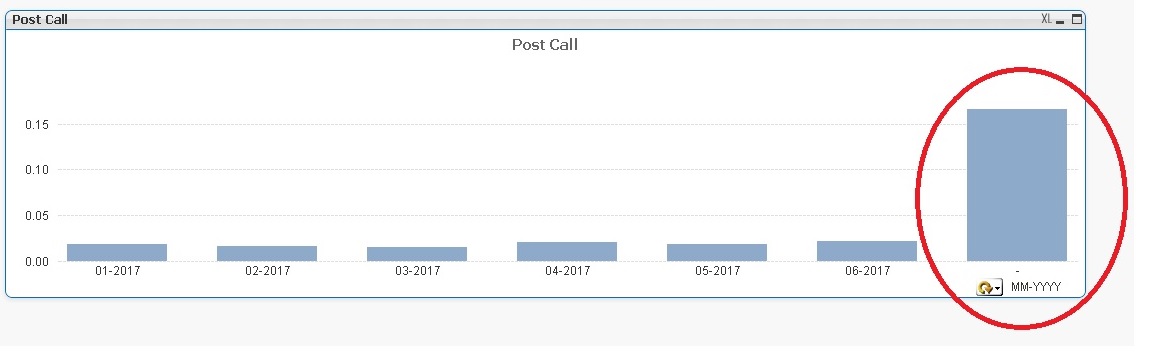
I'm having a dash (-) on my x axis in the chart.
I'm having a dash  on my x axis which is for the Yr-Mo Dates. I tried to suppress the nulls but this dash didn't go away. I also tried to take out all the NULLs from the Post Call data but still the problem persists. I'm not sure if this is a data problem. Can you please help me figure out if this is a data problem and finally take this out of the chart? Please see attached file for your reference. Thank you in advance.
- Mark as New
- Bookmark
- Subscribe
- Mute
- Subscribe to RSS Feed
- Permalink
- Report Inappropriate Content
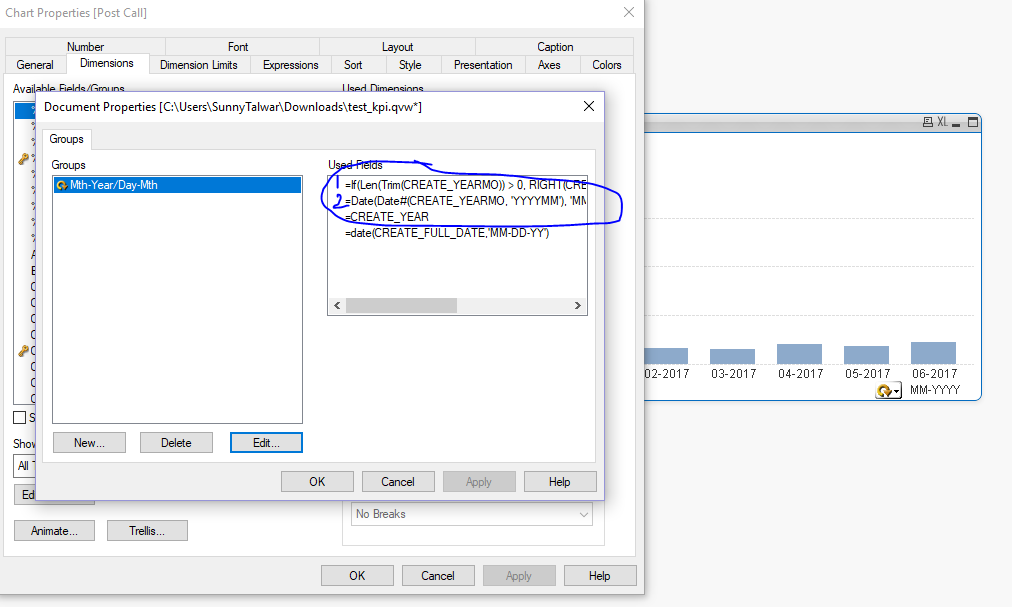
You have used this as your cycle group dimension
RIGHT(CREATE_YEARMO,2) & '-' & LEFT(CREATE_YEARMO,4)
Where the dash ( - ) is coming from the red thing above. Just add a null check for CREATE_YEARMO
=If(Len(Trim(CREATE_YEARMO)) > 0, RIGHT(CREATE_YEARMO,2) & '-' & LEFT(CREATE_YEARMO,4))
Or you can use this (although I suggest fixing this in the script)
=Date(Date#(CREATE_YEARMO, 'YYYYMM'), 'MM-YYYY')
I have added both the expressions in your sample
- Mark as New
- Bookmark
- Subscribe
- Mute
- Subscribe to RSS Feed
- Permalink
- Report Inappropriate Content
Hi Sunny!
Thank you for your help. It worked! 🙂 You're the best! Thank you for always helping me.  I really appreciate it so much!