Unlock a world of possibilities! Login now and discover the exclusive benefits awaiting you.
- Qlik Community
- :
- All Forums
- :
- QlikView App Dev
- :
- Re: I need a bar graph that compares the day I sel...
- Subscribe to RSS Feed
- Mark Topic as New
- Mark Topic as Read
- Float this Topic for Current User
- Bookmark
- Subscribe
- Mute
- Printer Friendly Page
- Mark as New
- Bookmark
- Subscribe
- Mute
- Subscribe to RSS Feed
- Permalink
- Report Inappropriate Content
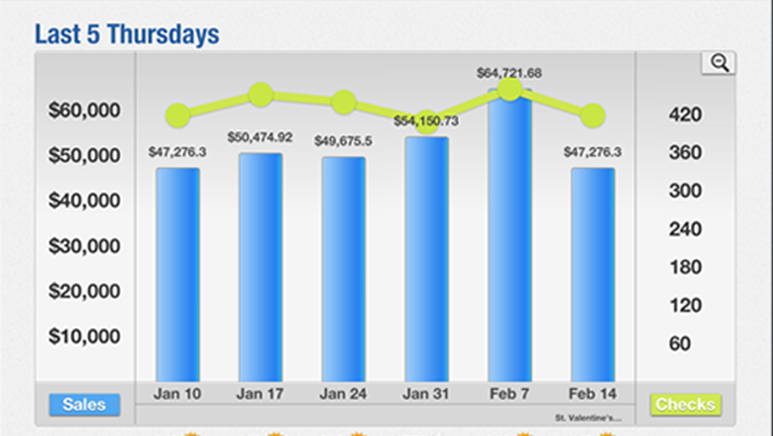
I need a bar graph that compares the day I select with the same day of the previous 5 weeks
Good afternoon
I need a graph of bars that compare the day that they select with their same day of the previous 5 weeks,
I know you can, but there is no podium to follow.
Accepted Solutions
- Mark as New
- Bookmark
- Subscribe
- Mute
- Subscribe to RSS Feed
- Permalink
- Report Inappropriate Content
Instead of Date field in Barchart dimension, use calculated dimension like
if(num(Date)>= $(MaxDate)-34, Date) -- and mark Suppress when value is NULL.
MaxDate is a UI Variable Max(Date).
- Mark as New
- Bookmark
- Subscribe
- Mute
- Subscribe to RSS Feed
- Permalink
- Report Inappropriate Content
Can you share sample
- Mark as New
- Bookmark
- Subscribe
- Mute
- Subscribe to RSS Feed
- Permalink
- Report Inappropriate Content
Hi Javier,
Maybe something like this (attached file)?
Dates:
LOAD
Date(Date('18.12.2016') + RecNo() - 1) as Period
autogenerate(Date(Today()) - Date('18.12.2016') + 1);
autoCalendar:
LOAD
Date(Period) as %Date,
WeekDay(Period) as DayWeek,
Week(Period) as NumberWeek
Resident Dates;
Sales:
Load
Period as %Date,
Num(Period) as NumDate,
Div(Rand()*1000, 1) as Sale
Resident Dates;
DROP Table Dates;
Add variable varDate.
On a sheet of creating a new histogram.
Add Calculated Dimension:
=ValueList(Date(varDate - 35), Date(varDate - 28), Date(varDate - 21), Date(varDate - 14), Date(varDate - 7), Date(varDate))
Add Expression:
If (ValueList(Date(varDate - 35), Date(varDate - 28), Date(varDate - 21), Date(varDate - 14), Date(varDate - 7), Date(varDate)) = Date(varDate - 35), Sum({<NumDate= {$(#=varDate-35)}>} Sale),
If (ValueList(Date(varDate - 35), Date(varDate - 28), Date(varDate - 21), Date(varDate - 14), Date(varDate - 7), Date(varDate)) = Date(varDate - 28), Sum({<NumDate= {$(#=varDate-28)}>} Sale),
If (ValueList(Date(varDate - 35), Date(varDate - 28), Date(varDate - 21), Date(varDate - 14), Date(varDate - 7), Date(varDate)) = Date(varDate - 21), Sum({<NumDate= {$(#=varDate-21)}>} Sale),
If (ValueList(Date(varDate - 35), Date(varDate - 28), Date(varDate - 21), Date(varDate - 14), Date(varDate - 7), Date(varDate)) = Date(varDate - 14), Sum({<NumDate= {$(#=varDate-14)}>} Sale),
If (ValueList(Date(varDate - 35), Date(varDate - 28), Date(varDate - 21), Date(varDate - 14), Date(varDate - 7), Date(varDate)) = Date(varDate - 7), Sum({<NumDate= {$(#=varDate-7)}>} Sale),
If (ValueList(Date(varDate - 35), Date(varDate - 28), Date(varDate - 21), Date(varDate - 14), Date(varDate - 7), Date(varDate)) = Date(varDate), Sum({<NumDate= {$(#varDate)}>} Sale),
))))))
Result
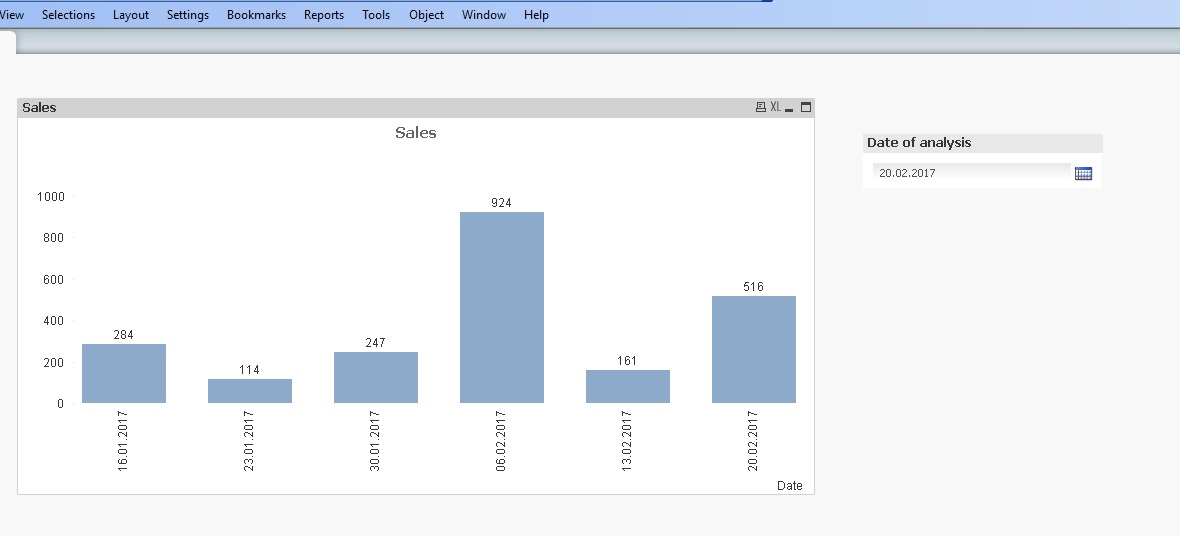
Regards,
Andrey
- Mark as New
- Bookmark
- Subscribe
- Mute
- Subscribe to RSS Feed
- Permalink
- Report Inappropriate Content
Try something like this:
Script
1. Create a Year & Week in your script for YrWk
2. Create a WeekDay(yourdate) for the Week Name
Variables
* Create variables
vMxWk = max(YrWk)
vMnWk = min(YrWk)
vWkName = Maxstring(WkName)
Chart
* Your dimension
Date field
* Your expression will be:
sum({1<YrWk={'>=$(vMnWk)<=$(vMxWk)'}, WkName={'$(vWkName)'}>}Amt)
----
Please see attached for reference.
- Mark as New
- Bookmark
- Subscribe
- Mute
- Subscribe to RSS Feed
- Permalink
- Report Inappropriate Content
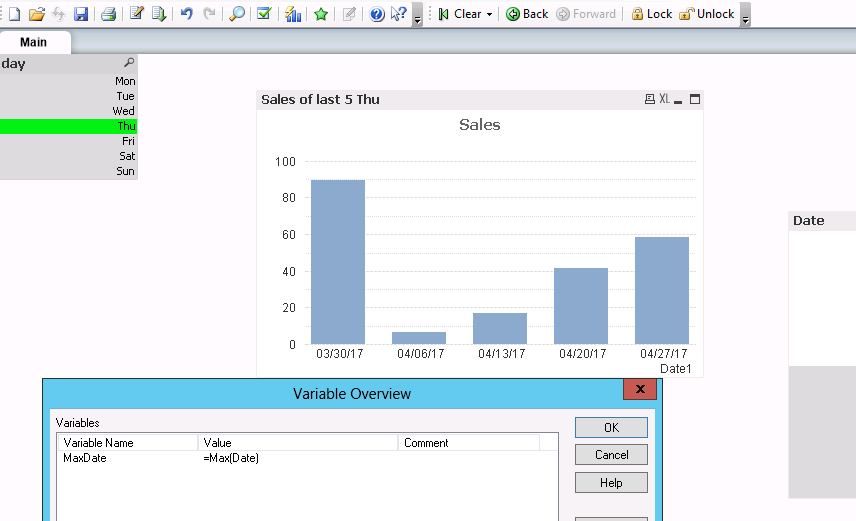
Instead of Date field in Barchart dimension, use calculated dimension like
if(num(Date)>= $(MaxDate)-34, Date) -- and mark Suppress when value is NULL.
MaxDate is a UI Variable Max(Date).
- Mark as New
- Bookmark
- Subscribe
- Mute
- Subscribe to RSS Feed
- Permalink
- Report Inappropriate Content
good morning,
Effectively that is what I want to obtain, however the qvw does not respond, I follow the same steps and in my qvw does not load either