Unlock a world of possibilities! Login now and discover the exclusive benefits awaiting you.
- Qlik Community
- :
- All Forums
- :
- QlikView App Dev
- :
- Re: I want to add values to legend of my bar chart...
- Subscribe to RSS Feed
- Mark Topic as New
- Mark Topic as Read
- Float this Topic for Current User
- Bookmark
- Subscribe
- Mute
- Printer Friendly Page
- Mark as New
- Bookmark
- Subscribe
- Mute
- Subscribe to RSS Feed
- Permalink
- Report Inappropriate Content
I want to add values to legend of my bar chart legend
Hello,
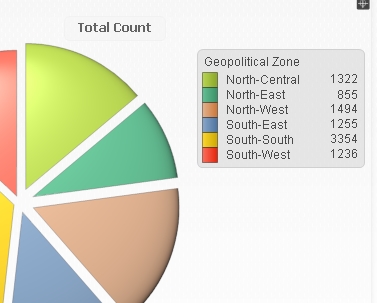
I wanna add values to legend of my bar chart as in pie chart
- Mark as New
- Bookmark
- Subscribe
- Mute
- Subscribe to RSS Feed
- Permalink
- Report Inappropriate Content
For your Bar Chart do have just one Dimension and one Expression, like your Pie Chart ?
If so then how about using the Values on Data Points setting for your Expression.
Otherwise could share a screen shot of your Bar Chart ?
- Mark as New
- Bookmark
- Subscribe
- Mute
- Subscribe to RSS Feed
- Permalink
- Report Inappropriate Content
See attached.... what you can do is in the label for each expression put your actual label in single quotes and then concatenate the expression which calculates the numeric value you want to see on your legend as shown on the bar chart I attached. For example I have an expression that sums values so for my expression label I have this....
='SUM ' & sum(Value)